ChartPros Market Insights
March 14 Chart of the Day - Tesla
Tesla (TSLA) has been one of the most requested charts in recent memory because of the constant selling pressure and traders and investors trying to find the bottom.
We don't call tops/bottoms but we do review charts from a price action technical analysis perspective.
See the area on the chart that could be the "last chance" for the bulls!
June 8 Chart of the Day - Tesla


Have you heard about Tesla's stock price?
If you answered "of course I have" then you realize that after falling from its all time high of $414.50 (adjusted for stock splits) down below $110 when everyone was saying that Elon Musk might not really be that smart you also know that the electric vehicle (EV) maker has more than doubled since January 2023.
So what if you missed the train and want to hop aboard the Tesla express /aka/ its stock or related options.
Well, we've identified some potential upside targets as well as pull back levels that could possibly provide some reasonable reward to risk returns.
See Tesla's Stock Price Targets
How High Can the Markets Go?

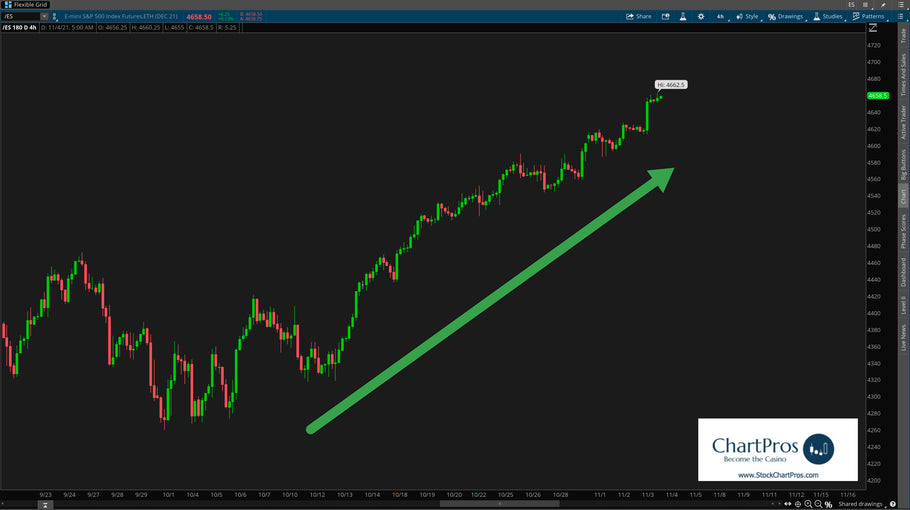
We frequently get asked "How High Can the Markets Go?"
The true answer is no one really knows for sure but technical analysis can help determine potential targets.
Once a market reaches its target there's no telling what can happen then. The prudent thing as a trader is to allow it time to develop new structure.