April 17 Chart of the Day - ASML
Precision oriented price action technical analysis by far provides the best edges and most setups for traders across the markets so that's what we use for the basis of our reviews.
ASML, the largest supplier of equipment to computer chip makers, said first quarter profit beat expectations on Wednesday, however, sales missed forecasts, which sent shares lower.
Since price had been recently trading near all time highs (ATH) we wanted to see how much lower and review their chart from a price action technical analysis perspective.
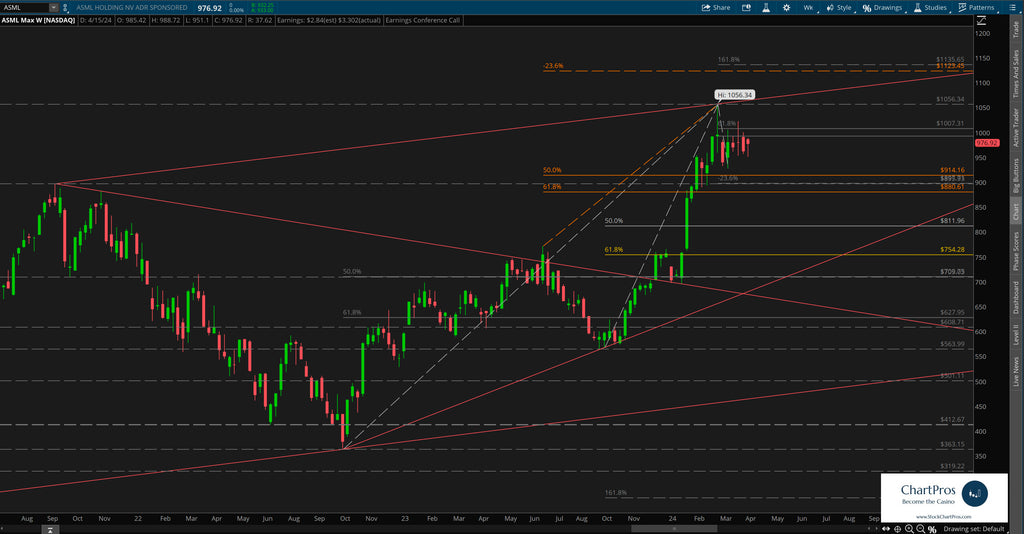
Weekly Chart Pre-Earnings
Weekly Chart Post-Earnings
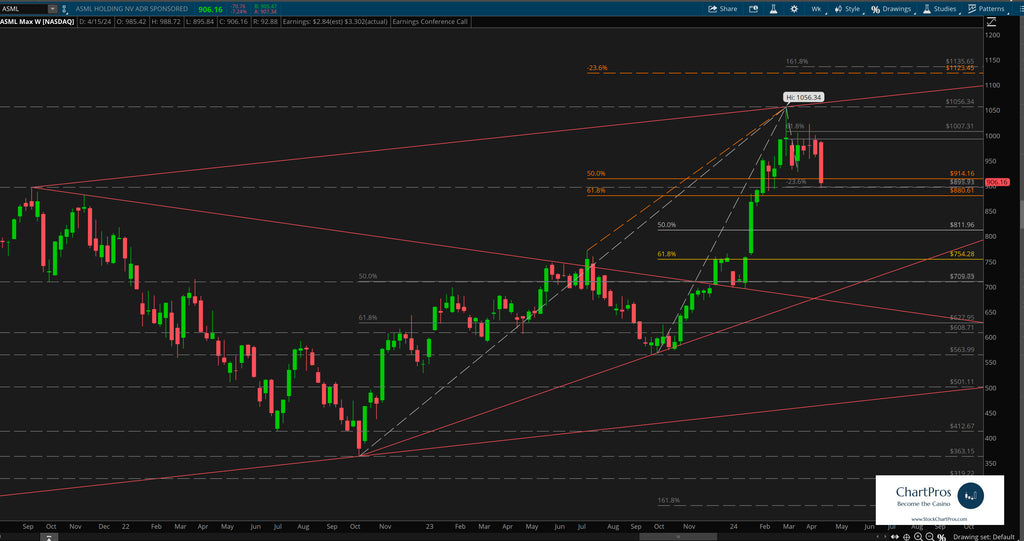
On the weekly chart we can see that yes price is indeed dropping in dramatic fashion today but to be honest, not all surprising as price essentially headed back towards a significant support/resistance level in the form of previous ATHs.
Daily Chart Post-Earnings
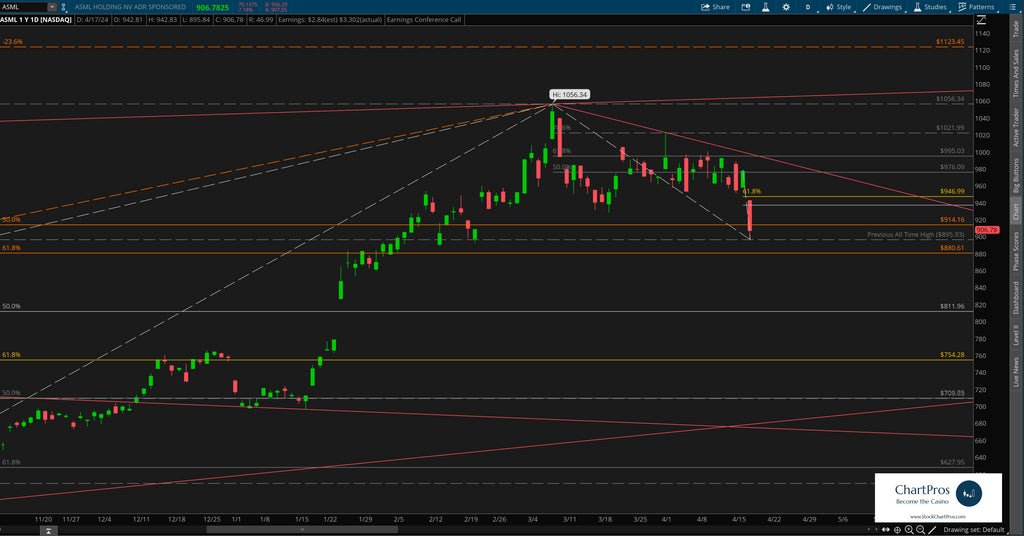
On the daily chart we can see with much more clarity the drop in price today towards previous ATHs.
We've layered in Fibonacci levels in both directions including Advanced High to High bull Fibonacci levels shown in orange that can be used with hyper trending price action like this.
Armed with precision oriented charts like these both traders and investors can formulate their respective plans.
So what's next?
We don't make predictions...
Nobody knows for sure but using these 5 price action tools traders and investors can develop levels of interest in both directions.
- Support/Resistance
- Trend
- Fibonacci
- Supply/Demand Zones,
- Change Control Zones
ChartPros provides the exact methodology in its price action technical analysis courses to create charts like this with the most precise and accurate levels from which investors and traders can formulate their respective trade plans.
Take a look at the charts and let us know what you think.
We'd like to hear from you in the comments sections.
