April 3 Chart of the Day - UnitedHealth Group
Precision oriented price action technical analysis by far provides the best edges and most setups for traders across the markets so that's what we use for the basis of our reviews.
Healthcare stocks such as UnitedHealth Group (UNH), a DOW 30 stock, are making headlines this week and are under pressure after Medicare Advantage plan payments for 2025 came in lower than expected.
We wanted to review their chart from a price action technical analysis perspective because so many other equities are trading at all time highs (ATH) but this chart is not...
Monthly Chart
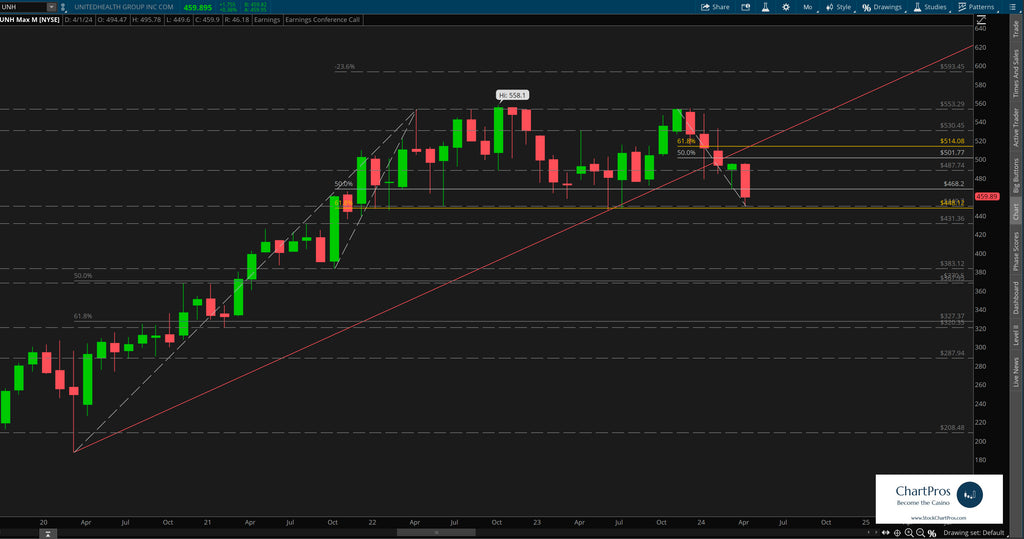
On the monthly chart we can see that the 5+ year up trend was recently breached and may be in danger of falling further. Since making its $558.10 ATH back in October 2023 price has once made a lower high and is close to making a lower low.
Weekly Chart
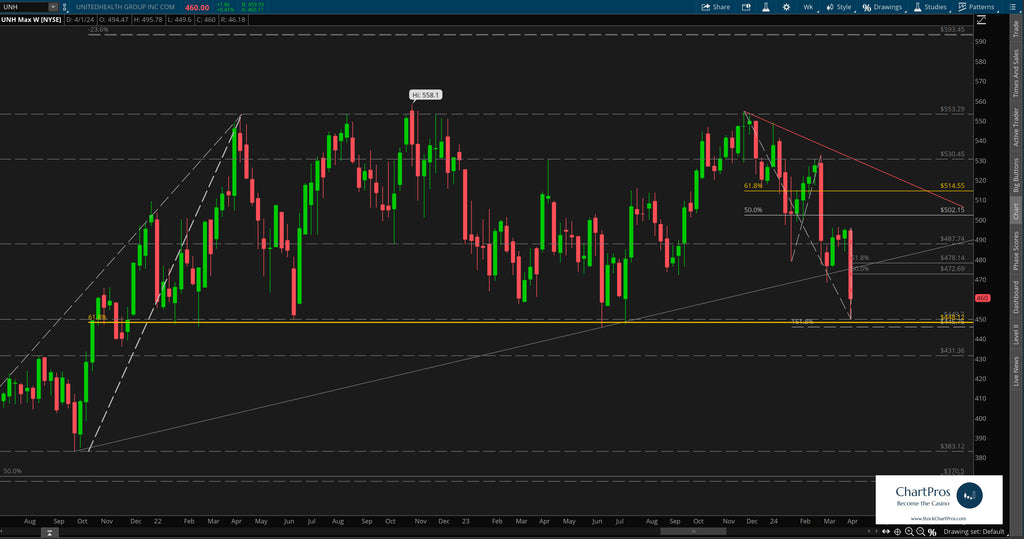
Down on the weekly chart we can see price level $450 acting as a line in the sand. Price has test this area seven times in the last 18+ months and each time the UNH bulls stepped in to push price up.
That level was tested as recently as this morning and we have to pose the question "are the bulls getting weary and can they continue to hold there?"
Perhaps a relief bounce here, or to the moon...
We've layered in Fibonacci in both directions to identify potential levels of interest and wouldn't be terribly surprised to see price rally yet again from here.
Armed with precision oriented charts like these both traders and investors can formulate their respective plans.
So what's next?
We don't make predictions...
Nobody knows for sure but using these 5 price action tools traders and investors can develop levels of interest in both directions.
- Support/Resistance
- Trend
- Fibonacci
- Supply/Demand Zones,
- Change Control Zones
ChartPros provides the exact methodology in its price action technical analysis courses to create charts like this with the most precise and accurate levels from which investors and traders can formulate their respective trade plans.
Take a look at the charts and let us know what you think.
We'd like to hear from you in the comments sections.
