March 15 Chart of the Day - Gilead Sciences
Precision oriented price action technical analysis by far provides the best edges and most setups for traders across the markets so that's what we use for the basis of our reviews.
Gilead Sciences, Inc. (GILD) is a research-based biopharmaceutical company focused on the discovery, development, and commercialization of innovative medicines.
The company will be able to quadruple production of its cell therapy cancer treatments by 2026 due to improvements in the U.S. biotech's manufacturing processes, an executive in charge of that business told Reuters.
We'll take a look from a price action technical analysis perspective and today we'll simply provide you with the charts.
Be sure to submit any questions or comments!
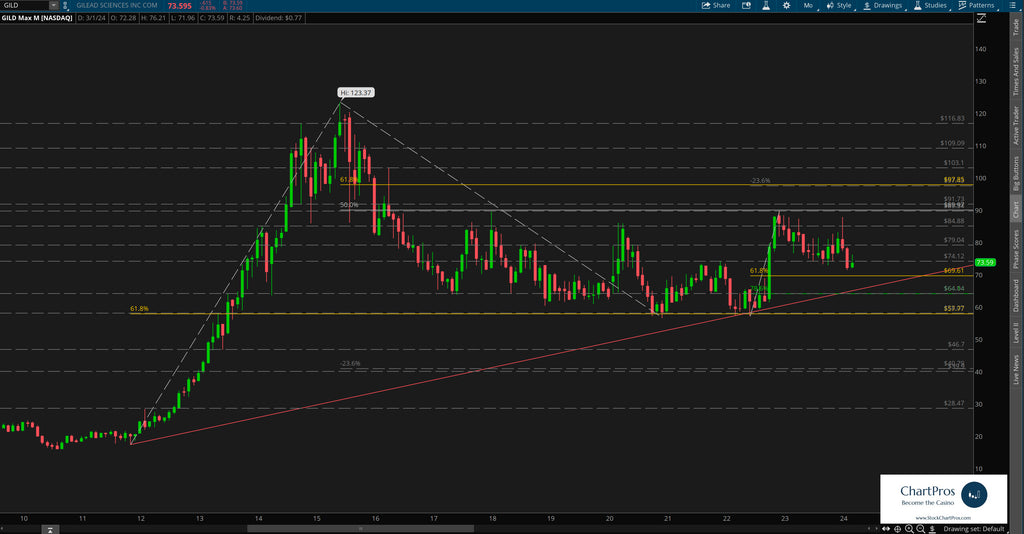
Monthly Chart
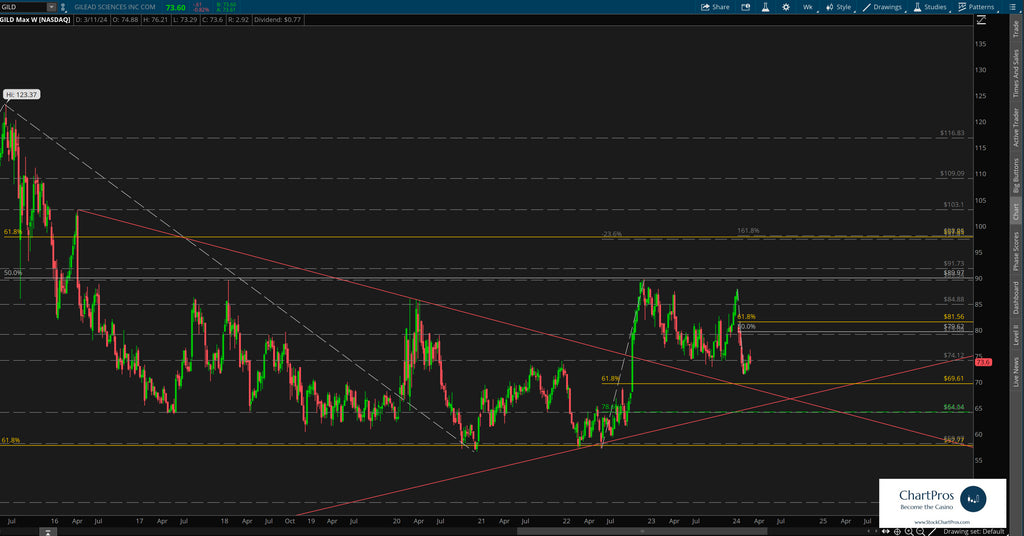
Weekly Chart
Armed with this precision oriented information both traders and investors can formulate their respective plans.
So what's next?
We don't make predictions...
Nobody knows for sure but using these 5 price action tools traders and investors can develop levels of interest in both directions.
- Support/Resistance
- Trend
- Fibonacci
- Supply/Demand Zones,
- Change Control Zones
ChartPros provides the exact methodology in its price action technical analysis courses to create charts like this with the most precise and accurate levels from which investors and traders can formulate their respective trade plans.
Take a look at the charts and let us know what you think.
We'd like to hear from you in the comments sections.