March 21 Chart of the Day - Ansys
Precision oriented price action technical analysis by far provides the best edges and most setups for traders across the markets so that's what we use for the basis of our reviews.
We posted a poll in our Highly Rated Trade Room and on our social media accounts to see what type of chart that traders would like to see featured today.
The choices were:
- A S&P 500 Stock
- A NASDAQ 100 Stock
- A Warren Buffet Top Holding
- Bitcoin
The winner was a NASDAQ 100 stock...
Ansys (ANSS), a NASDAQ 100 company, develops and markets CAE/multiphysics engineering simulation software for product design, testing and operation and offers its products and services to customers worldwide.
The company made headlines this week by announcing they recently strengthened their collaboration with NVIDIA (NVDA) to boost the advancement of simulation solutions backed by pioneering technologies like computing and generative AI.
With this in mind we set out to review their chart from a price action technical analysis perspective.
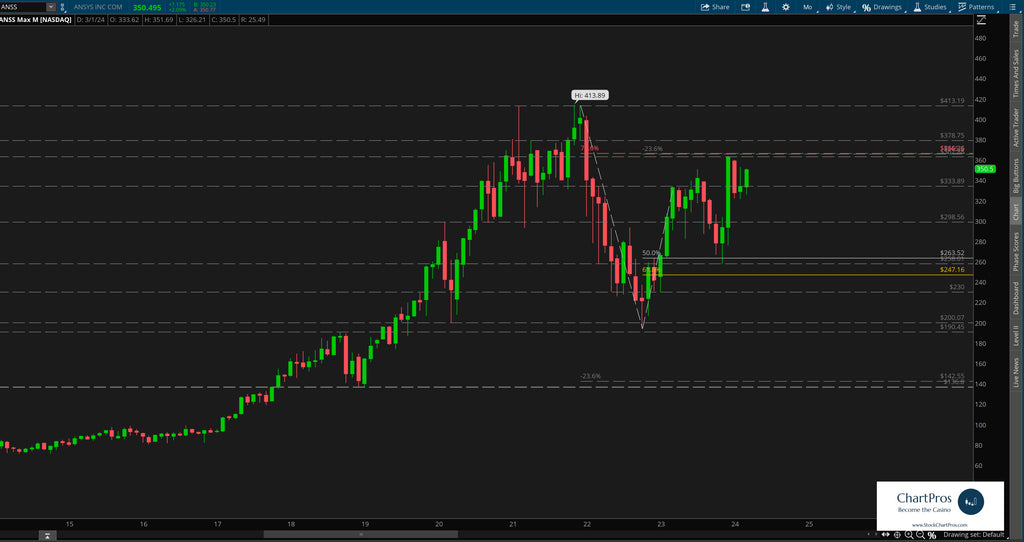
On the monthly chart we can see over 25 years of historical chart data which we consider to be a positive when marking up any chart.
Trading around $350 earlier today, price is off its $413.89 all time high (ATH) set in late 2021 but up significantly after fading down to the $200 area in late 2022.
And since price is not trading at ATH and presents two sided price action we set out to identify levels of interest in both directions.
Monthly Chart
Down on the weekly chart we can see price making a series of higher highs and higher lows as it moves back up towards that ATH level.
We've layered in both bear and bull Fibonacci levels, support/resistance levels, and trend lines in both directions to narrow in where price could be heading.
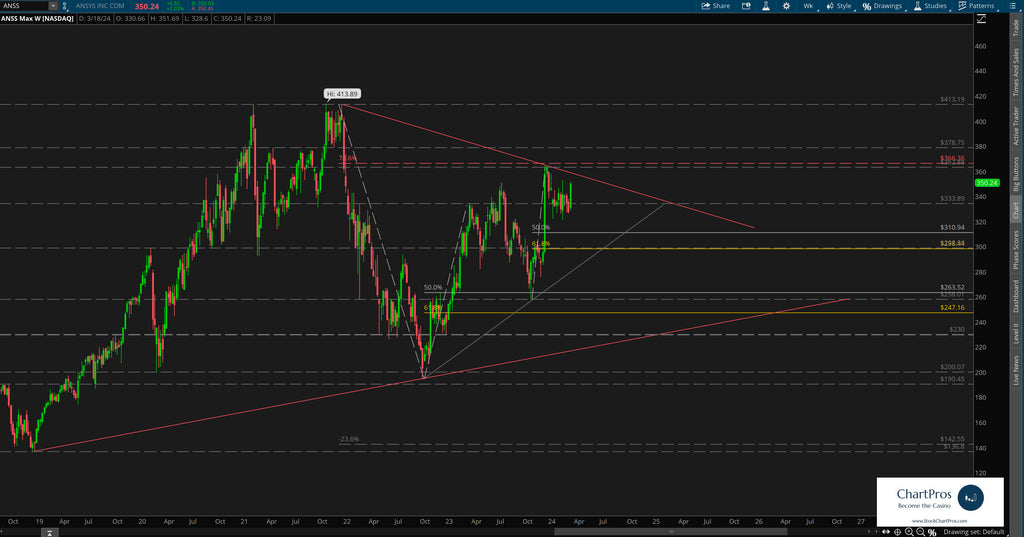
Armed with precision oriented charts like these both traders and investors can formulate their respective plans.
So what's next?
We don't make predictions...
Nobody knows for sure but using these 5 price action tools traders and investors can develop levels of interest in both directions.
- Support/Resistance
- Trend
- Fibonacci
- Supply/Demand Zones,
- Change Control Zones
ChartPros provides the exact methodology in its price action technical analysis courses to create charts like this with the most precise and accurate levels from which investors and traders can formulate their respective trade plans.
Take a look at the charts and let us know what you think.
We'd like to hear from you in the comments sections.
