April 1 Chart of the Day - United Airlines
Precision oriented price action technical analysis by far provides the best edges and most setups for traders across the markets so that's what we use for the basis of our reviews.
United Airlines (UAL) is making headlines today because published reports state that the company is asking pilots to take unpaid time off in May and possibly through the summer because of a shortage of new Boeing planes.
We wanted to review their chart from a price action technical analysis perspective because it seems like the airline industry woes just continue to pile up...
Monthly Chart
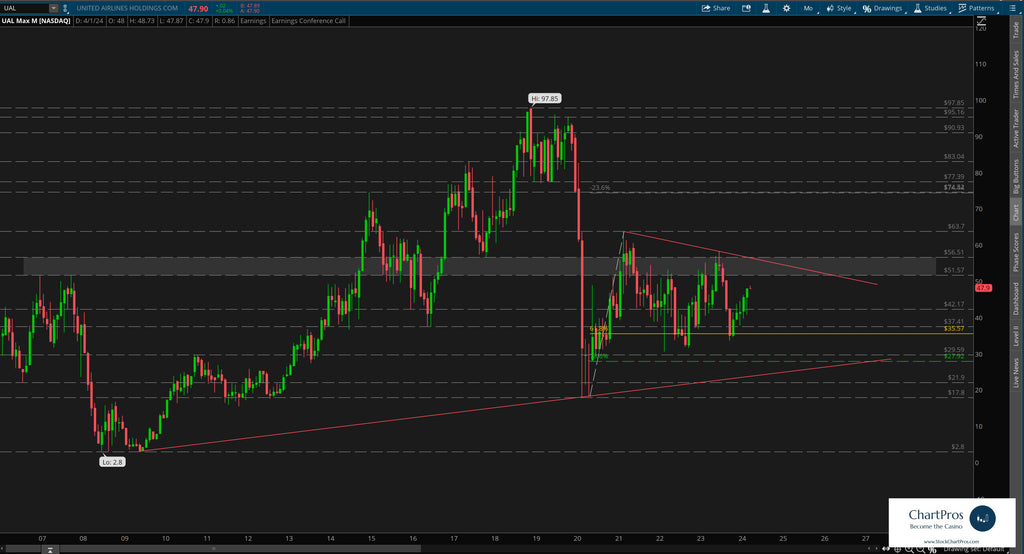
On the monthly chart we can see that since its $17.80 pandemic low in 2020 price has tried to make a series of higher highs and higher lows only to stall out on its last attempt to make a higher high.
Along the way price crossed a change control zone (gray rectangle) roughly between $51.50 and $56.50 multiple times.
Change control zones are one of the five price action tools we teach when charting anything. By definition, they are an area that represents where neither the bulls nor bears are in charge. Price can slash though the zone with seemingly reckless abandon, price can respect the top or bottom from outside it or within it. Or, price can trade aimlessly sideways within it. When price breaks away from the zone it can often get drawn back to it like a magnet. And in this case we see all of the above are true.
Overall, price has crossed or respected the zone from above and below nearly 30 times on this viewpoint with the bulk of those coming in the last four years.
Weekly Chart
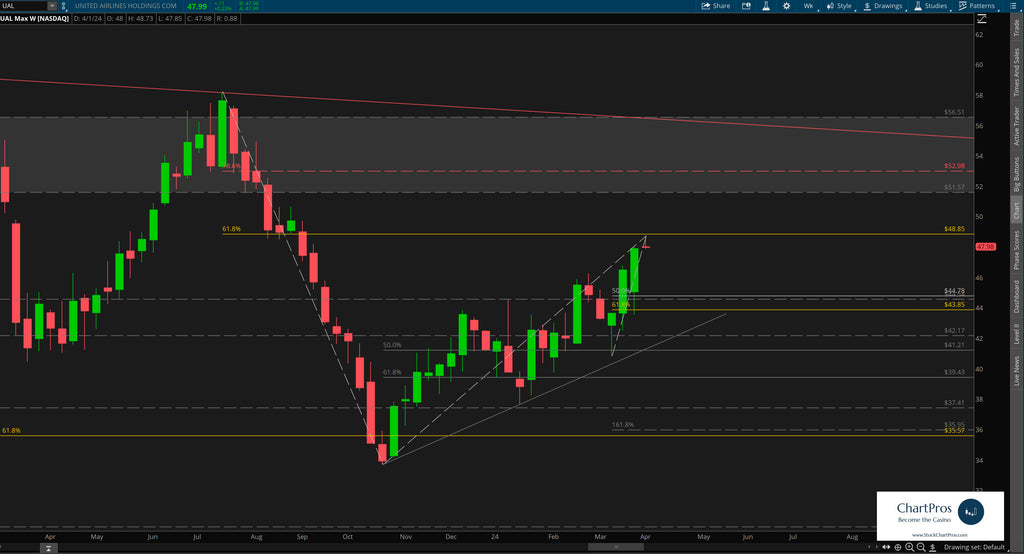
Down on the weekly chart we can see the change control zone seemingly acting like a magnet once again trying to pull price back up to it.
We've layered in Fibonacci in both directions to identify potential levels of interest and wouldn't be terribly surprised to see price eventually get back up to the change control area.
Trading just shy of $48 earlier today, it will be interesting to see if the upcoming unpaid pilot leave, and thus fewer flights, acts as an accelerant to price in either direction.
Armed with precision oriented charts like these both traders and investors can formulate their respective plans.
So what's next?
We don't make predictions...
Nobody knows for sure but using these 5 price action tools traders and investors can develop levels of interest in both directions.
- Support/Resistance
- Trend
- Fibonacci
- Supply/Demand Zones,
- Change Control Zones
ChartPros provides the exact methodology in its price action technical analysis courses to create charts like this with the most precise and accurate levels from which investors and traders can formulate their respective trade plans.
Take a look at the charts and let us know what you think.
We'd like to hear from you in the comments sections.
