April 10 Chart of the Day - Starbucks
Precision oriented price action technical analysis by far provides the best edges and most setups for traders across the markets so that's what we use for the basis of our reviews.
Today we feature Starbucks (SBUX) again because price keeps dropping and traders keep asking for updated charts.
So here's our latest price action technical analysis review. (see previous post here)
Monthly Chart
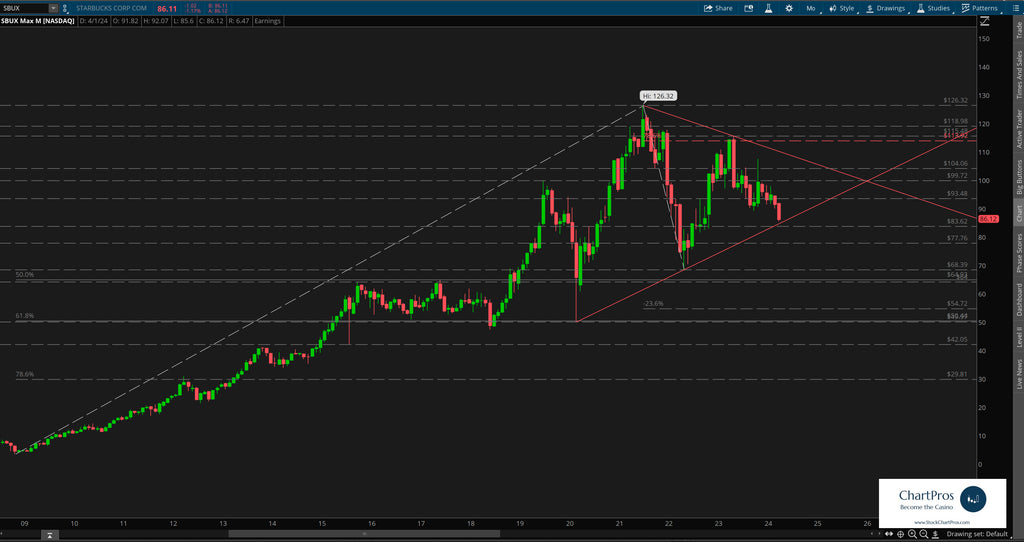
On the monthly chart we noticed price continues to fall but may be approaching areas of potential support.
Weekly Chart
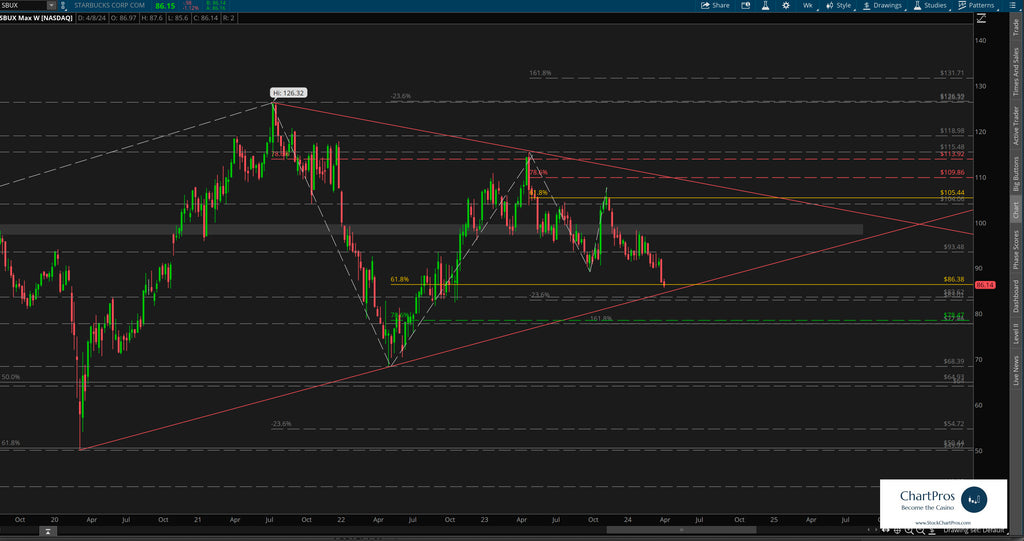
On the weekly chart we can see the potential area of support with much more clarity.
If the Starbucks bulls don't step in here then you guessed it, price will continue to keep falling and traders will continue to ask for updates...
Armed with precision oriented charts like these both traders and investors can formulate their respective plans.
So what's next?
We don't make predictions...
Nobody knows for sure but using these 5 price action tools traders and investors can develop levels of interest in both directions.
- Support/Resistance
- Trend
- Fibonacci
- Supply/Demand Zones,
- Change Control Zones
ChartPros provides the exact methodology in its price action technical analysis courses to create charts like this with the most precise and accurate levels from which investors and traders can formulate their respective trade plans.
Take a look at the charts and let us know what you think.
We'd like to hear from you in the comments sections.
