April 11 Chart of the Day - Spirit Aerosystems
Precision oriented price action technical analysis by far provides the best edges and most setups for traders across the markets so that's what we use for the basis of our reviews.
Spirit Aerosystems (SPR) is a US based aerostructure manufacturer that builds several components of Boeing aircraft, including the fuselage of the 737 and 787, as well as the flight deck section of the fuselage of nearly all Boeing airliners. The company also supplies Airbus with products that total about a fifth of Spirit's revenues but the vast majority of the rest come from Boeing.
The company is in the headlines this week as Boeing sorts out its production woes and everyone seems to be watching.
We'll review Spirit's chart from a price action technical analysis perspective.
Monthly Chart
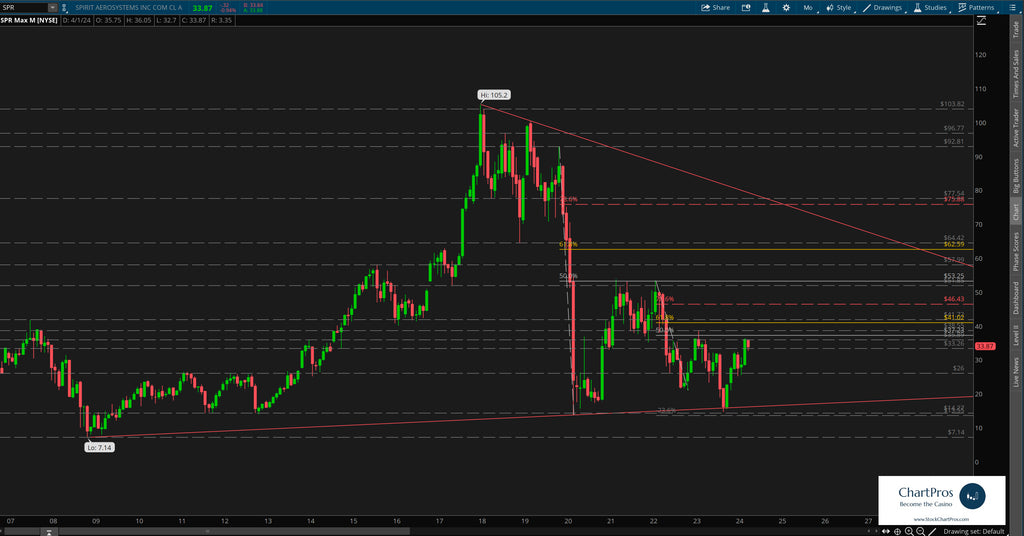
On the monthly chart we noticed that price is well off its $105.20 all time high (ATH) set back in 2017. In fact, price fell in dramatic fashion since then all the way down to the $15 area before bouncing.
Price bounced from that $15 area up to the $53 area before fading back to retest the $15 area and bouncing again to its current $33.75 levels.
That $15 area seems to be the proverbial "line in the sand" at least for now.
Weekly Chart
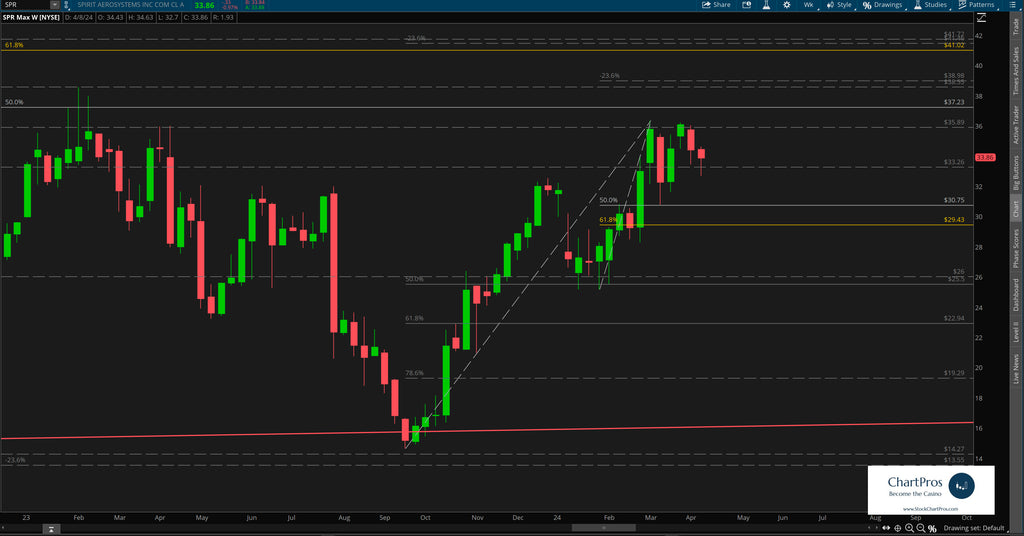
On the weekly chart we can see the most recent bounce with much more clarity as price struggles to make higher highs and higher lows.
We've layered in Fibonacci, trend, and support/resistance in both directions to identify potential levels of interest.
Armed with precision oriented charts like these both traders and investors can formulate their respective plans.
So what's next?
We don't make predictions...
Nobody knows for sure but using these 5 price action tools traders and investors can develop levels of interest in both directions.
- Support/Resistance
- Trend
- Fibonacci
- Supply/Demand Zones,
- Change Control Zones
ChartPros provides the exact methodology in its price action technical analysis courses to create charts like this with the most precise and accurate levels from which investors and traders can formulate their respective trade plans.
Take a look at the charts and let us know what you think.
We'd like to hear from you in the comments sections.
