April 15 Chart of the Day - NIO
Precision oriented price action technical analysis by far provides the best edges and most setups for traders across the markets so that's what we use for the basis of our reviews.
NIO (NIO) is a Chinese multinational automobile manufacturer headquartered in Shanghai, specializing in designing and developing electric vehicles. The company develops battery-swapping stations for its vehicles, as an alternative to conventional charging stations.
NIO has been making headlines recently as their stock keeps "plunging" as published headlines state so we wanted to review their chart from a price action technical analysis perspective.
Monthly Chart
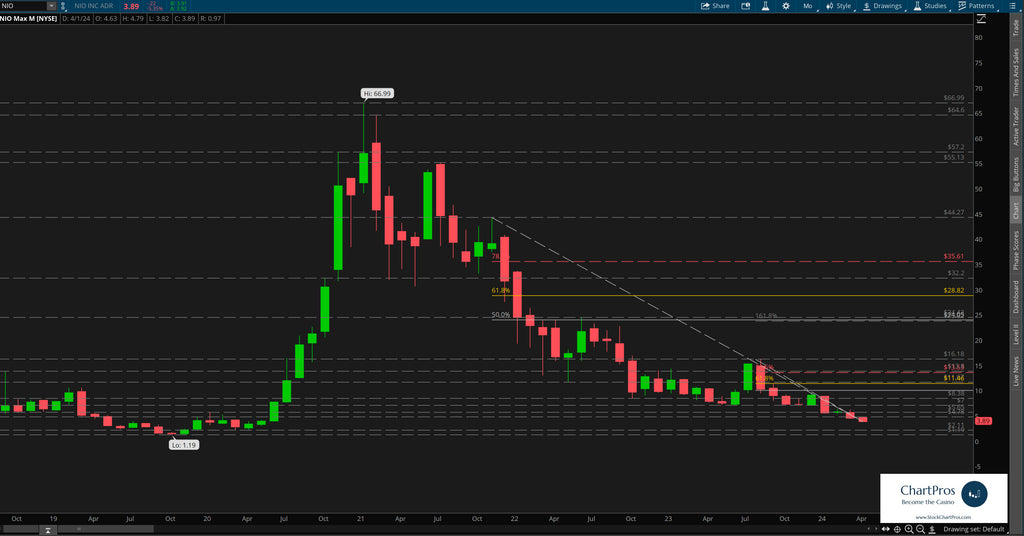
On the monthly chart we can see that the recent headlines aren't kidding...
After makings its debut in the public markets price zoomed up and made its $66.99 all time high (ATH) back in late 2021.
But since then it's been nothing but sell, sell, sell at CNBC's Jim Cramer might say.
Price is approaching its $1.19 all time low and at the current rate of descent it might just get there.
Weekly Chart
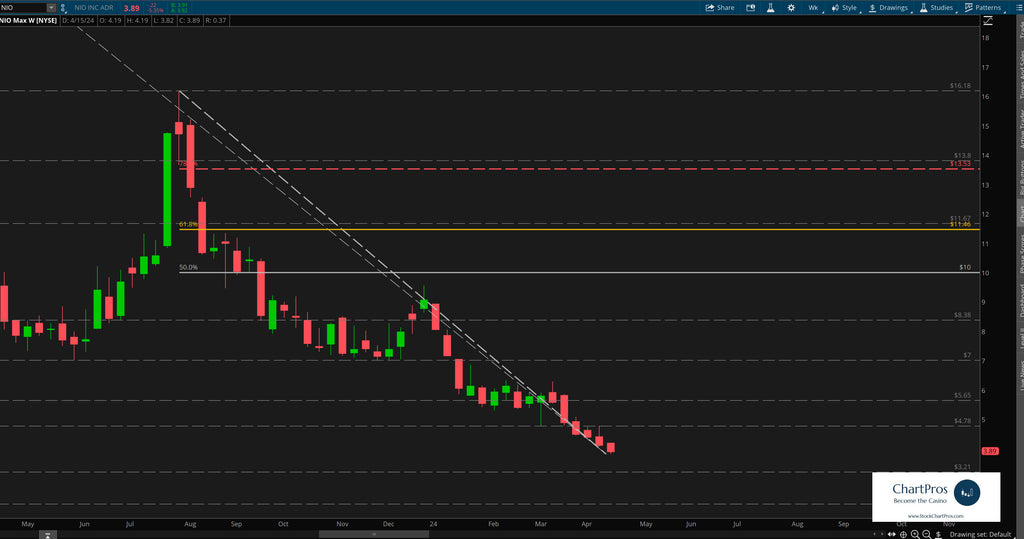
On the weekly chart we can see with much more clarity price making a series of lower highs and lower lows simply back tracking where it once came from.
Price closed at $3.89 today and with no active bull Fibonacci levels the best we suggest is to simply use previous support/resistance levels.
Keep in mind, "it can only go to $0" as a prior mentor would famously boast about any chart. (AK)
Should price catch a bid and begin to climb again we've layered in bear Fibonacci levels that could act as potential targets.
Armed with precision oriented charts like these both traders and investors can formulate their respective plans.
So what's next?
We don't make predictions...
Nobody knows for sure but using these 5 price action tools traders and investors can develop levels of interest in both directions.
- Support/Resistance
- Trend
- Fibonacci
- Supply/Demand Zones,
- Change Control Zones
ChartPros provides the exact methodology in its price action technical analysis courses to create charts like this with the most precise and accurate levels from which investors and traders can formulate their respective trade plans.
Take a look at the charts and let us know what you think.
We'd like to hear from you in the comments sections.
