April 16 Chart of the Day - US Bank
Precision oriented price action technical analysis by far provides the best edges and most setups for traders across the markets so that's what we use for the basis of our reviews.
US Bancorp (USB) /aka/ US Bank is making headlines this week because... well it seems many banks have been making headlines recently for a variety of reasons so we wanted to review their chart from a price action technical analysis perspective.
According to the bank's website, they are #150 on the Fortune 500 list.
Monthly Chart
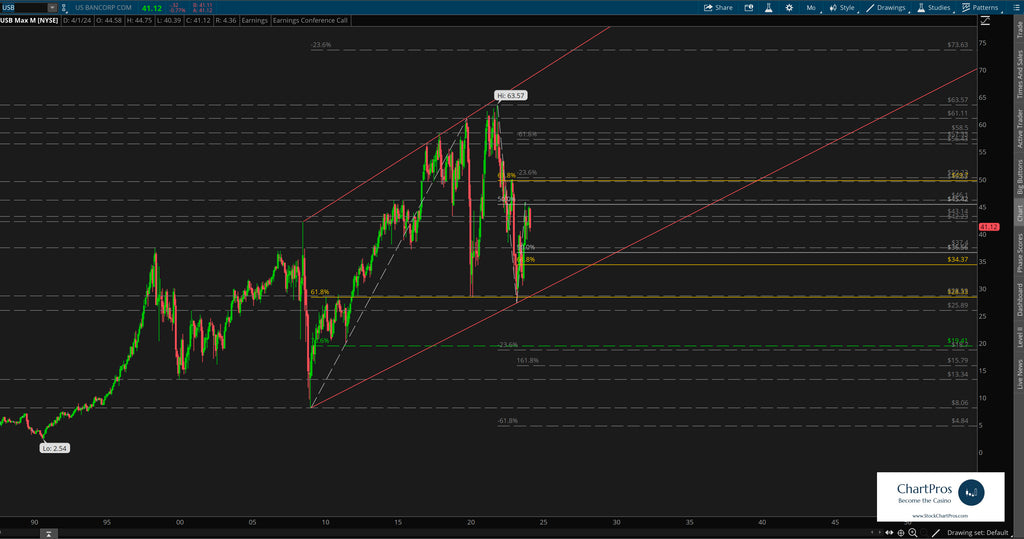
On the monthly chart we can see over three decades of historical price action with the bulk of the last decade using $45.50 as a "meeting point." Each time price broke above or below that level it seemingly returned.
Trading at $41.12 earlier today price is in familiar territory.
Weekly Chart

On the weekly chart we can see with much more clarity the break above and below that level only to return and consolidate there.
During the last 15 months or so price has formed a wedge like formation. As most traders know, wedges can often be broken to the upside or downside.
We've layered in Fibonacci levels in both directions inside the wedge as well as outside of it to use as potential targets.
Armed with precision oriented charts like these both traders and investors can formulate their respective plans.
So what's next?
We don't make predictions...
Nobody knows for sure but using these 5 price action tools traders and investors can develop levels of interest in both directions.
- Support/Resistance
- Trend
- Fibonacci
- Supply/Demand Zones,
- Change Control Zones
ChartPros provides the exact methodology in its price action technical analysis courses to create charts like this with the most precise and accurate levels from which investors and traders can formulate their respective trade plans.
Take a look at the charts and let us know what you think.
We'd like to hear from you in the comments sections.
