April 18 Chart of the Day - Taiwan Semiconductor Manufacturing Corporation
Precision oriented price action technical analysis by far provides the best edges and most setups for traders across the markets so that's what we use for the basis of our reviews.
Taiwan Semiconductor Manufacturing Corporation (TSM) is the world’s largest producer of advanced processors and counts companies such as Nvidia and Apple as its clients.
The company reported better-than-expected first-quarter top and bottom-line results Thursday. However, the company lowered its chip market outlook as it sees consumer weakness persisting which overshadowed its Q1 performance. As a result, their stock fell nearly 7% today so we wanted to review their chart from a price action technical analysis perspective.
Monthly Chart
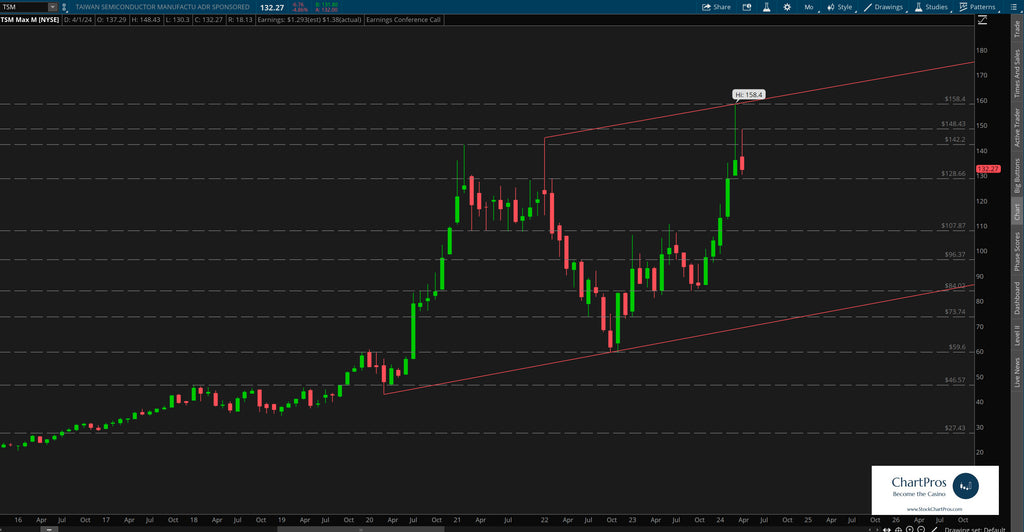
On the monthly chart we've plotted what we consider a "basic structure" chart, meaning the chart only includes support/resistance and trend lines. This is always our first step when charting anything.
We can see price quickly retreating from its fresh $158.40 all time high (ATH) set about a month ago back towards familiar price levels.
Weekly Chart
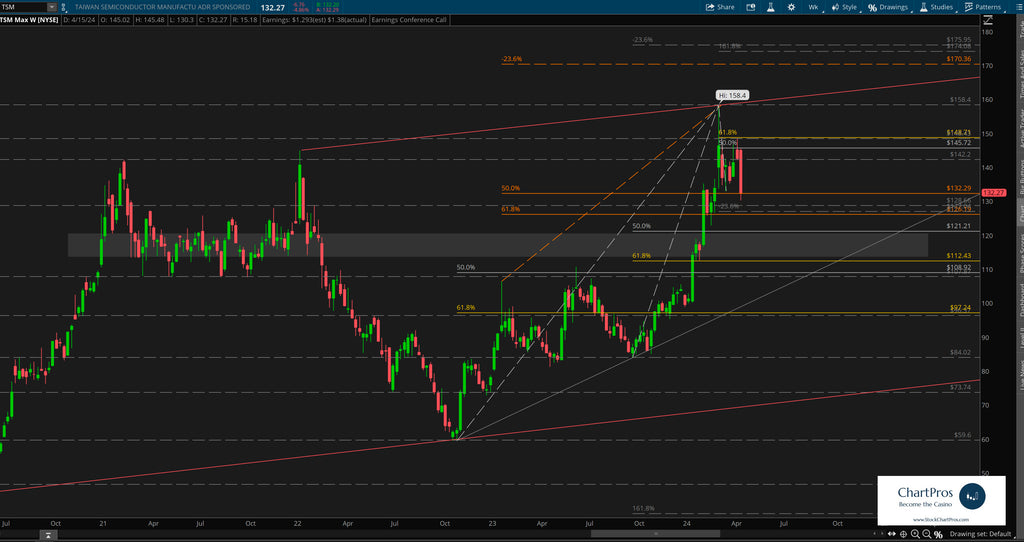
On the weekly chart we can see with much more clarity the rapid descent from ATHs back towards a change control zone (gray rectangle) roughly between $113-$120.
Change control zones are one of the five price action tools we teach when charting anything. By definition, they are an area that represents where neither the bulls nor bears are in charge. Price can slash though the zone with seemingly reckless abandon, price can respect the top or bottom from outside it or within it. Or, price can trade aimlessly sideways within it. When price breaks away from the zone it can often get drawn back to it like a magnet. And in this case we see all of the above are true.
We've also layered in Fibonacci levels in both directions in both directions to use as potential levels of interest and/or future price targets.
Armed with precision oriented charts like these both traders and investors can formulate their respective plans.
So what's next?
We don't make predictions...
Nobody knows for sure but using these 5 price action tools traders and investors can develop levels of interest in both directions.
- Support/Resistance
- Trend
- Fibonacci
- Supply/Demand Zones,
- Change Control Zones
ChartPros provides the exact methodology in its price action technical analysis courses to create charts like this with the most precise and accurate levels from which investors and traders can formulate their respective trade plans.
Take a look at the charts and let us know what you think.
We'd like to hear from you in the comments sections.
