April 19 Chart of the Day - Sprott Physical Gold and Silver Trust
Precision oriented price action technical analysis by far provides the best edges and most setups for traders across the markets so that's what we use for the basis of our reviews.
Sprott Physical Gold and Silver Trust (CEF) is a closed-end fund that invests in gold and silver, with a mix of 2/3 gold and 1/3 silver.
The trust has been in the headlines recently with the rising price of gold and silver so we wanted to review the chart from a price action technical analysis perspective.
Monthly Chart

On the monthly chart we can see over 30 years worth of historical price action in which case more data is typically better.
We can see price recently broke out and above a wedge pattern formation towards potential upside resistance in the form of a bear Fibonacci 78.6% level as well as previous support/resistance (S/R).
Weekly Chart
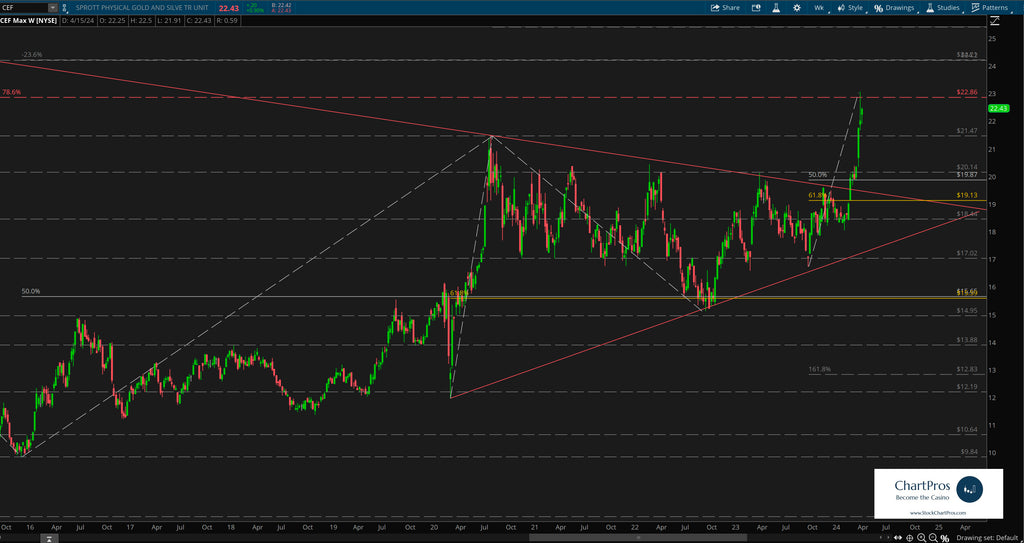
On the weekly chart we can see with much more clarity the rapid ascent up and away from the wedge powering through prior S/R levels.
We've also layered in Fibonacci levels in both directions in both directions to use as potential levels of interest and/or future price targets.
Armed with precision oriented charts like these both traders and investors can formulate their respective plans.
So what's next?
We don't make predictions...
Nobody knows for sure but using these 5 price action tools traders and investors can develop levels of interest in both directions.
- Support/Resistance
- Trend
- Fibonacci
- Supply/Demand Zones,
- Change Control Zones
ChartPros provides the exact methodology in its price action technical analysis courses to create charts like this with the most precise and accurate levels from which investors and traders can formulate their respective trade plans.
Take a look at the charts and let us know what you think.
We'd like to hear from you in the comments sections.
