April 2 Chart of the Day - Gold
Precision oriented price action technical analysis by far provides the best edges and most setups for traders across the markets so that's what we use for the basis of our reviews.
Gold (ticker /GC on Think or Swim) has been on a massive bull run making multiple new all time highs (ATH) since Thanksgiving time frame and now it's becoming almost a weekly occurrence.
We see all the headlines calling for Gold $3000 and even $5000... and while that's totally possible, price never moves in a straight line - and we all know that any market cycles up and cycles down.
We've had many requests to identify upside targets for gold, which is not the same as calling a top!
So whether you're a gold trader or investor doesn't matter as the price action technical analysis techniques we're about to cover apply to any chart trading at or near ATHs. (Yes, even crypto ie. Bitcoin, AI stocks like NVIDIA, and similar)
The only price action tools that can be charted when price is at ATHs is trend and Fibonacci. And let us repeat - we do not predict tops (or bottoms) however, we can use technical analysis to identify potential upside targets. (Learn more about Trading All Time Highs here)
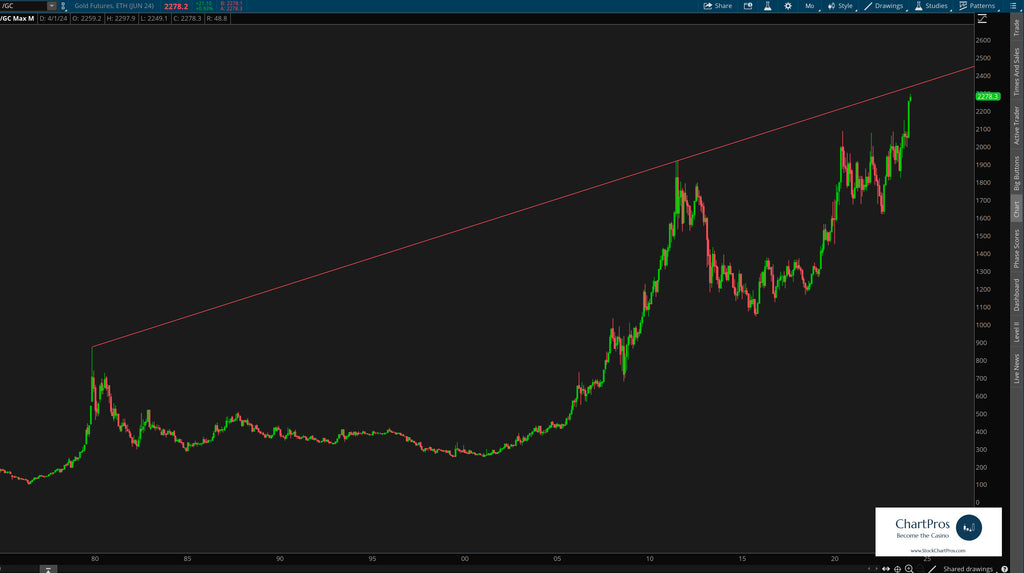
Monthly Chart - Trend Only
On this first monthly chart we've used only a trend line that started way back in the 1980 time frame, was established around 2011 and could possibly be tested in the "near future."
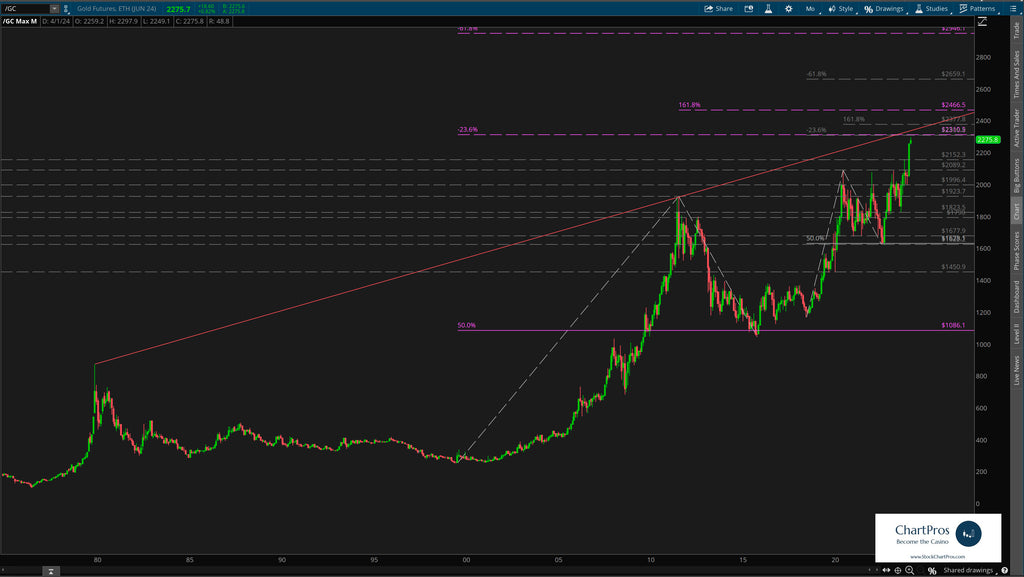
Monthly Chart - Trend and Fibonacci
On this next monthly view we've added Fibonacci because with valid retracements between the 50%, 61.8%, 78.6% levels we can then use the -23.6% and -61.8% Fib extension levels as potential completion targets.
In this case there are two Fib series we can use. The first one is older and colored in purple. We can see that price is approaching the first target -23.6% completion for that Fib.
Additionally, a more recent Fib colored in gray is also nearing its first target -23.6% completion which is within a few points of the purple target completion.
Both of these potential targets which are essentially sitting on top of each other just so happen to line up pretty darn close to that 40+ year old trend line...
Now does this mean that price will suddenly stop and drop like a rock if it hits these levels?
Not necessarily.
Remember, these are potential targets, not tops.
For the Fib enthusiasts, we've also used the 161.8% level which is often referred to as the ABCD level. It represents an additional target typically between the -23.6% and -61.8% Fib completion targets.
Traders and investors often use these levels for trade management purposes. Sometimes taking full or partial profits, and/or adjusting stop losses.
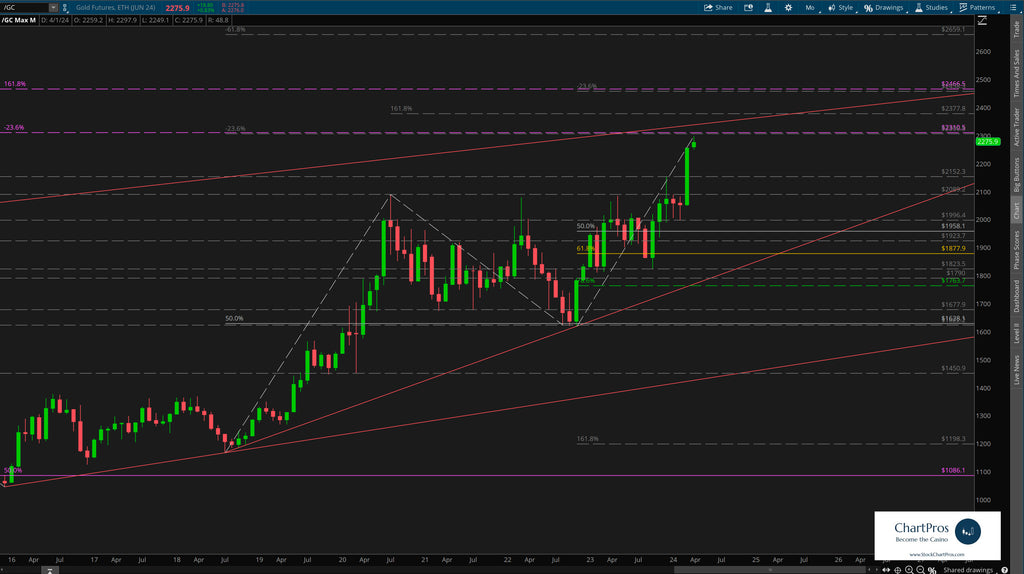
Monthly Chart - Trend and Fibonacci Zoomed In
This next view zooms us in so we can see the upside targets with more clarity. Plus, we've added more interim level Fibs and trend lines in the event price decides to pull back before reaching the upside targets. These could be potentially "pull back long" levels of interest.
If price continues to power up to the trend line or even above, all we do is simply adjust the high anchor to update the pull back levels.
Weekly Chart
Down on the weekly chart we can see even more clarity and additional Fibonacci levels. In this case we've applied an advanced high to high anchored Fib that can be used in fast trending, shallow retracement markets.
Ultimately, the question we attempt to answer in all cases is "where could price go?"

Armed with precision oriented charts like these both traders and investors can formulate their respective plans.
So what's next?
We don't make predictions...
Nobody knows for sure but using these 5 price action tools traders and investors can develop levels of interest in both directions.
- Support/Resistance
- Trend
- Fibonacci
- Supply/Demand Zones,
- Change Control Zones
ChartPros provides the exact methodology in its price action technical analysis courses to create charts like this with the most precise and accurate levels from which investors and traders can formulate their respective trade plans.
Take a look at the charts and let us know what you think.
We'd like to hear from you in the comments sections.
