April 22 Chart of the Day - AGNC Investment Corp
Precision oriented price action technical analysis by far provides the best edges and most setups for traders across the markets so that's what we use for the basis of our reviews.
AGNC Investment Corp (AGNC) is a relatively high paying dividend real estate investment trust (REIT) set to report earnings before the market opens on Tuesday April 23.
With many other companies set to report earnings this week as well we set out to review the AGNC chart from a price action technical analysis perspective.
Monthly Chart
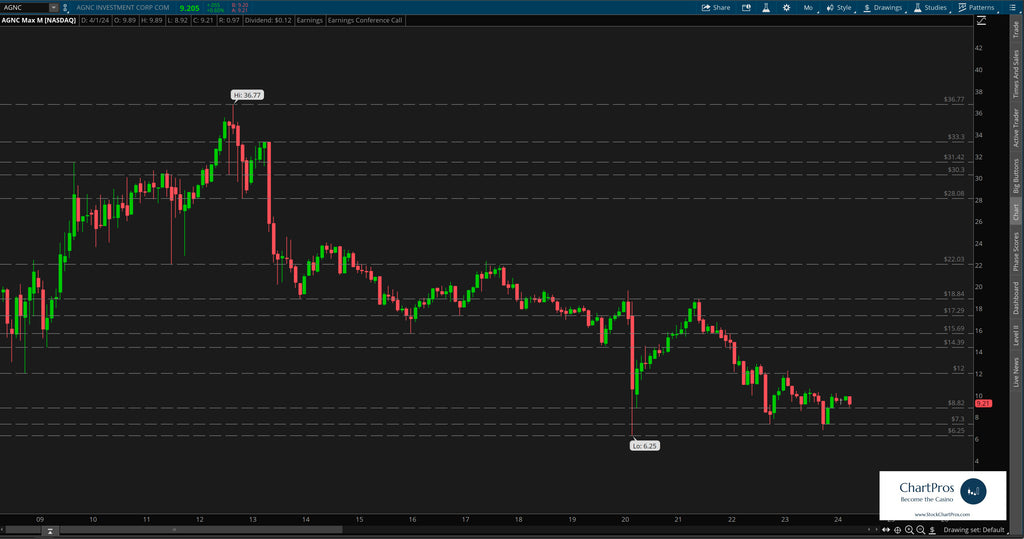
On the monthly chart we can see price has been making a series of lower highs and lower lows since setting its $36.77 all time high (ATH) back in 2012.
Trading around $9.20 earlier today we can see that price is up from its recent $6.25 all time low but has been creeping back down there for potentially another test or another lower low.
Weekly Chart
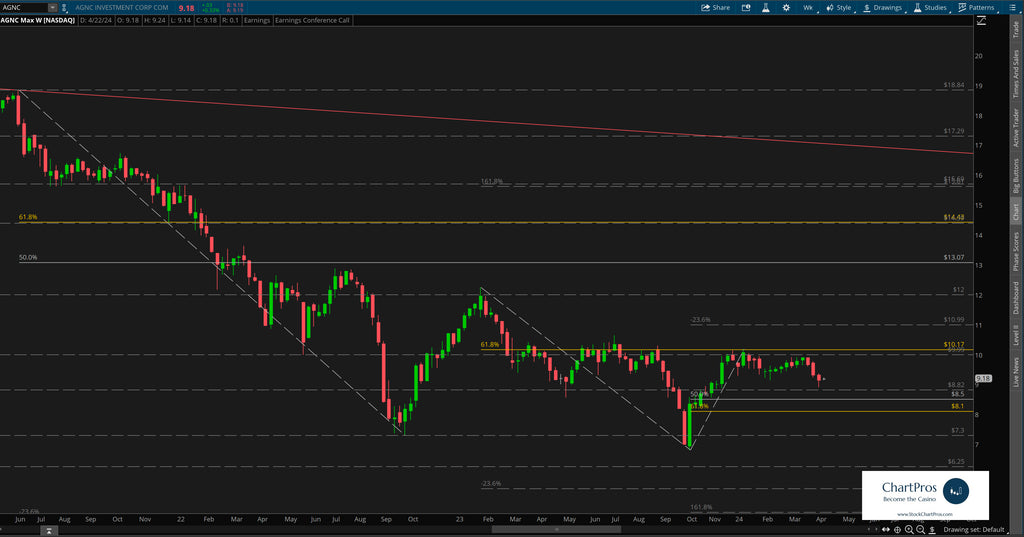
On the weekly chart we can see with much more clarity the rapid descent down and subsequent bounce off all time lows back up to the $10 area.
We've also layered in Fibonacci levels in both directions in both directions to use as potential levels of interest and/or future price targets.
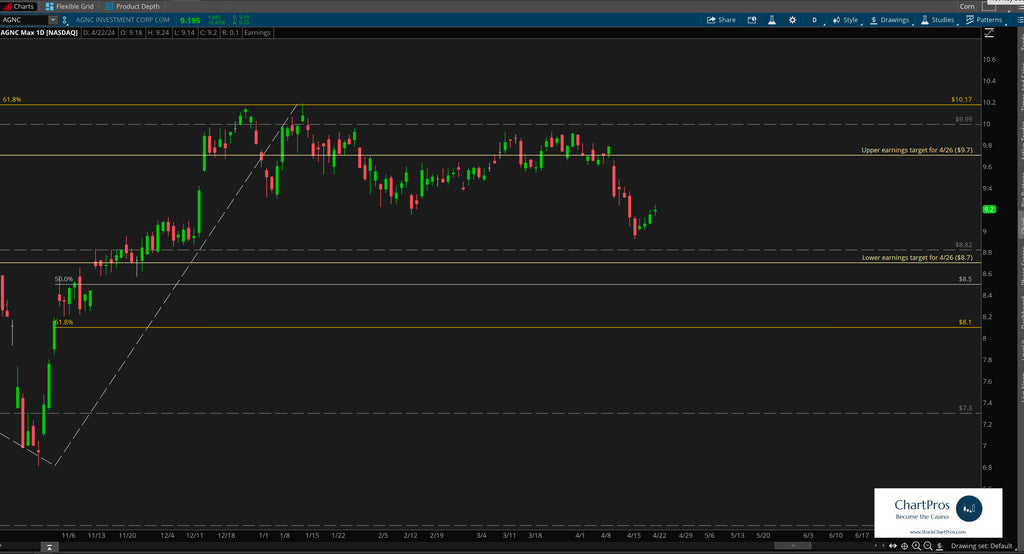
Daily Chart
For earnings we've included the implied target moves the market is anticipating by Friday April 26 by using the at the money straddle option cost for that expiration.
Armed with precision oriented charts like these both traders and investors can formulate their respective plans.
So what's next?
We don't make predictions...
Nobody knows for sure but using these 5 price action tools traders and investors can develop levels of interest in both directions.
- Support/Resistance
- Trend
- Fibonacci
- Supply/Demand Zones,
- Change Control Zones
ChartPros provides the exact methodology in its price action technical analysis courses to create charts like this with the most precise and accurate levels from which investors and traders can formulate their respective trade plans.
Take a look at the charts and let us know what you think.
We'd like to hear from you in the comments sections.
