April 23 Chart of the Day - Seagate Technology
Precision oriented price action technical analysis by far provides the best edges and most setups for traders across the markets so that's what we use for the basis of our reviews.
A global leader for over 40 years, Seagate Technology (STX) crafts precision-engineered data storage and management solutions. The company reports earnings after market close today and there seemingly is a lot of pre-release buying driving their stock price up.
With many other companies set to report earnings this week as well we set out to review their chart from a price action technical analysis perspective.
Monthly Chart

On the monthly chart we can see price has been pretty volatile during the past couple of years. Making its $117.67 all time high (ATH) back in early January 2022, price fell in dramatic fashion for the next 11 months or so after that making a definitive bottom at $47.47.
Since then price has been making a series of higher highs and higher lows all the way back up to the $100 area before facing some over head resistance and fading a bit.
Trading around $86.70 earlier today we can see that price is moving between previous support / resistance levels.
Weekly Chart
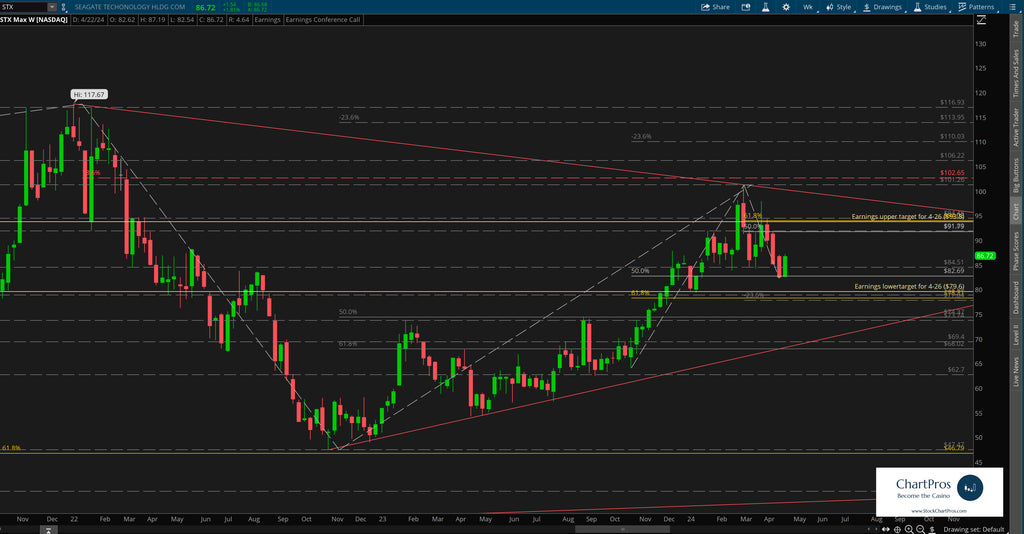
On the weekly chart we can see with much more clarity the rapid descent down and subsequent bounce back up to the $100 area.
Price seemingly is creating a wedge like formation where a down trend and an up trend are approaching each other. Eventually, price likely may pick a direction to break out from the wedge.
In the meantime, we've also layered in Fibonacci levels in both directions in both directions to use as potential levels of interest and/or future price targets.
Earnings Targets for This Week
For earnings we've included the implied target moves the market is anticipating by Friday April 26 by using the at the money straddle option cost for that expiration.
Armed with precision oriented charts like these both traders and investors can formulate their respective plans.
So what's next?
We don't make predictions...
Nobody knows for sure but using these 5 price action tools traders and investors can develop levels of interest in both directions.
- Support/Resistance
- Trend
- Fibonacci
- Supply/Demand Zones,
- Change Control Zones
ChartPros provides the exact methodology in its price action technical analysis courses to create charts like this with the most precise and accurate levels from which investors and traders can formulate their respective trade plans.
Take a look at the charts and let us know what you think.
We'd like to hear from you in the comments sections.
