April 24 Chart of the Day - Meta
Precision oriented price action technical analysis by far provides the best edges and most setups for traders across the markets so that's what we use for the basis of our reviews.
Meta (META) reports earnings after market close today and seemingly all eyes are on the social media giant.
When we last featured Meta in July 2023 price was trading shy of $300. Since then, price has gone on to make new all time highs (ATH) at $531.49 earlier this month.
Don't you wish you followed us then?
With many other companies set to report earnings this week as well we set out to review their chart from a price action technical analysis perspective.
Monthly Chart
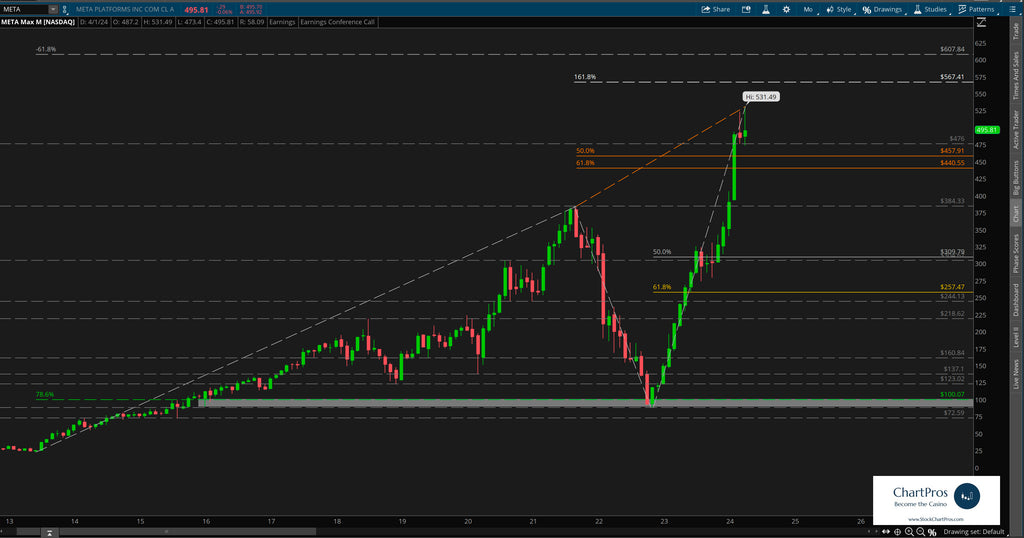
On the monthly chart we can see price rise to new ATHs. We've used the techniques taught in our Trading All Time Highs free market briefing to identify potential upside targets.
We've also used advanced Fibonacci high to high techniques to identify potential pull back levels should price continue to fade from here.
Trading around $495 earlier today we can see that price is consolidating for its next move up or down.
Weekly Chart
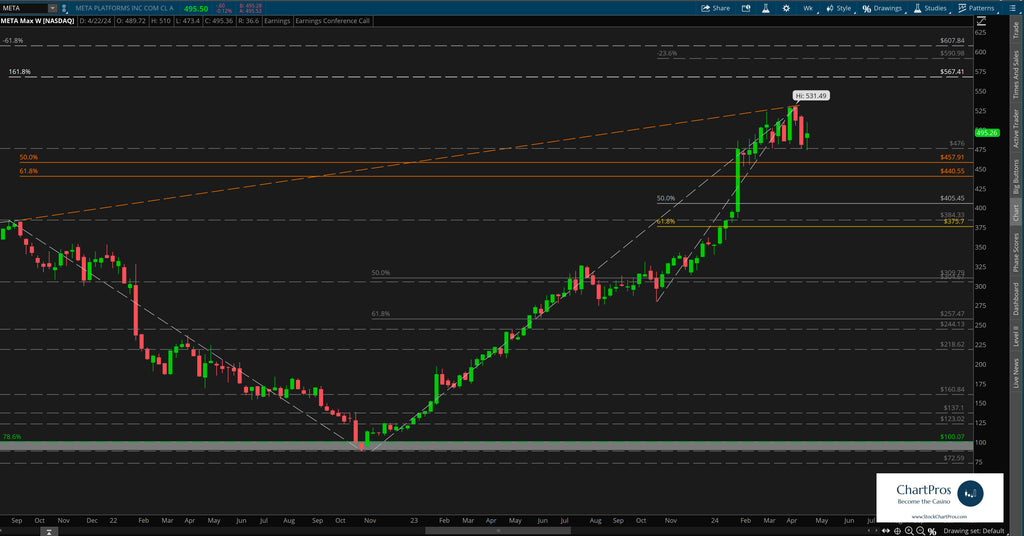
On the weekly chart we can see with much more clarity the rapid ascent up and subsequent new ATHs.
Price seemingly is seemingly taking a breather, perhaps waiting for earnings as a catalyst for its next move.
In the meantime, we've also layered in Fibonacci levels in both directions to use as potential levels of interest and/or future price targets.
Earnings Targets for This Week
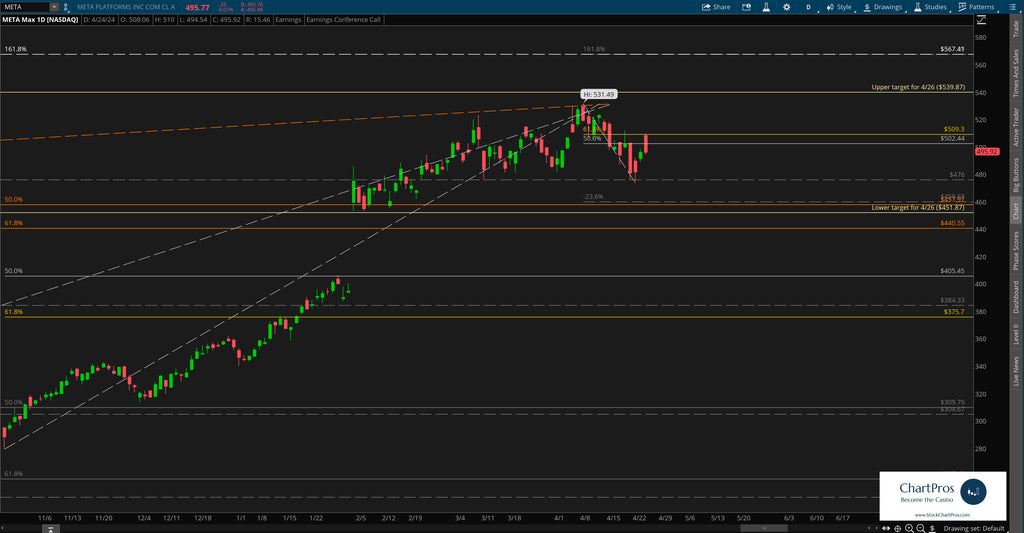
For earnings we've included the implied target moves the market is anticipating by Friday April 26 by using the at the money straddle option cost for that expiration.
Upside target - $539.87
Downside target - $451.87
Armed with precision oriented charts like these both traders and investors can formulate their respective plans.
So what's next?
We don't make predictions...
Nobody knows for sure but using these 5 price action tools traders and investors can develop levels of interest in both directions.
- Support/Resistance
- Trend
- Fibonacci
- Supply/Demand Zones,
- Change Control Zones
ChartPros provides the exact methodology in its price action technical analysis courses to create charts like this with the most precise and accurate levels from which investors and traders can formulate their respective trade plans.
Take a look at the charts and let us know what you think.
We'd like to hear from you in the comments sections.
