April 25 Chart of the Day - DexCom Inc.
Precision oriented price action technical analysis by far provides the best edges and most setups for traders across the markets so that's what we use for the basis of our reviews.
DexCom, Inc. (DXCM) develops, manufactures, produces, and distributes continuous glucose monitoring systems for diabetes management.
The company reports earnings today after market close and with so many other "big name companies" reporting this week we also wanted to review DexCom from a price action technical analysis perspective.
Monthly Chart
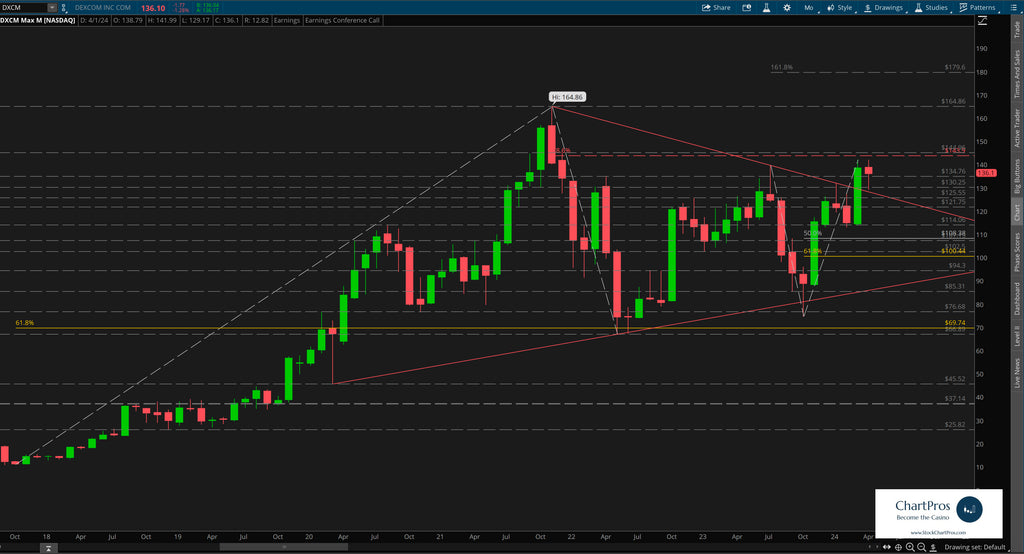
On the monthly chart we can see price is rising towards some potential overhead resistance and perhaps a "last chance for the bears" in the form of a 78.6% Fibonacci retracement and previous support/resistance before potentially testing $164.86 all time highs (ATH) set in late 2021.
We can also see that price recently broke out and upwards from a wedge pattern formation on this chart which is a bullish sign.
Trading around $136 earlier today we can see that price has been making a series of higher highs and higher lows during the past seven months or so.
Weekly Chart

On the weekly chart we can see with much more clarity the recent wedge breakout. The question remains whether or not price will continue up or retrace for a possible back test of the wedge formation.
Price seemingly is waiting for earnings as a catalyst for its next move.
In the meantime, we've also layered in Fibonacci levels in both directions to use as potential levels of interest and/or future price targets.
Earnings Targets for This Week
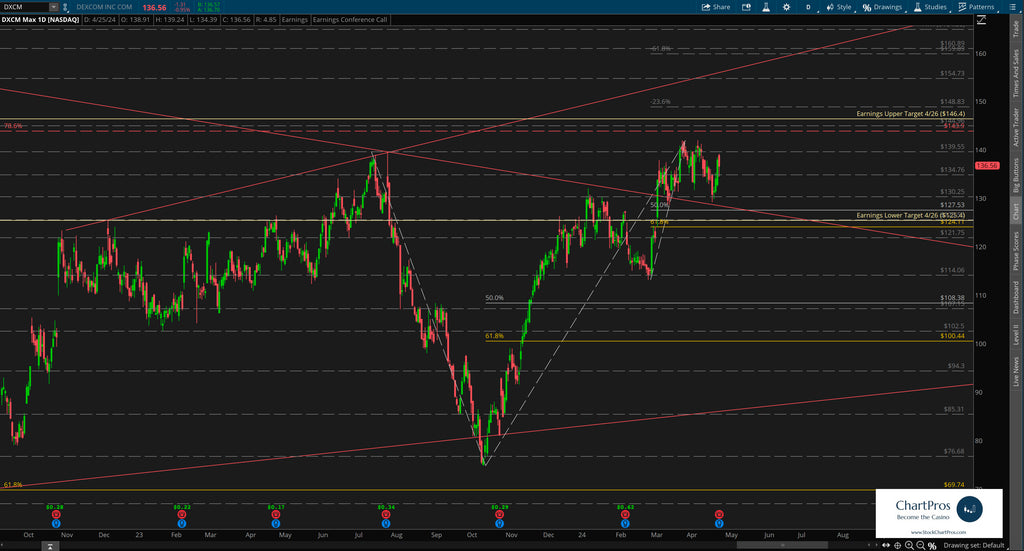
For earnings we've included the implied target moves the market is anticipating by Friday April 26 by using the at the money straddle option cost for that expiration.
Upside target - $146.40
Downside target - $125.40
Most of the option activity is on the call side with volume significantly greater than open interest on the $137, $138, $142, and $143 strikes.
Armed with precision oriented charts like these both traders and investors can formulate their respective plans.
So what's next?
We don't make predictions...
Nobody knows for sure but using these 5 price action tools traders and investors can develop levels of interest in both directions.
- Support/Resistance
- Trend
- Fibonacci
- Supply/Demand Zones,
- Change Control Zones
ChartPros provides the exact methodology in its price action technical analysis courses to create charts like this with the most precise and accurate levels from which investors and traders can formulate their respective trade plans.
Take a look at the charts and let us know what you think.
We'd like to hear from you in the comments sections.
