April 26 Chart of the Day - Exxon Mobil
Precision oriented price action technical analysis by far provides the best edges and most setups for traders across the markets so that's what we use for the basis of our reviews.
Oil majors Chevron (CVX) and ExxonMobil (XOM) stocks fell on Friday after both companies reported year-over-year profit declines for the first quarter that were impacted by lower natural gas prices and a decrease in refining margins.
When we last featured Exxon back on October 6, 2023 we shared a chart that might have saved those who bought the recent "fake breakout"...
Don't you wish you followed us then?
Because of the share price drop we wanted to update their chart from a price action technical analysis perspective.
Monthly Chart
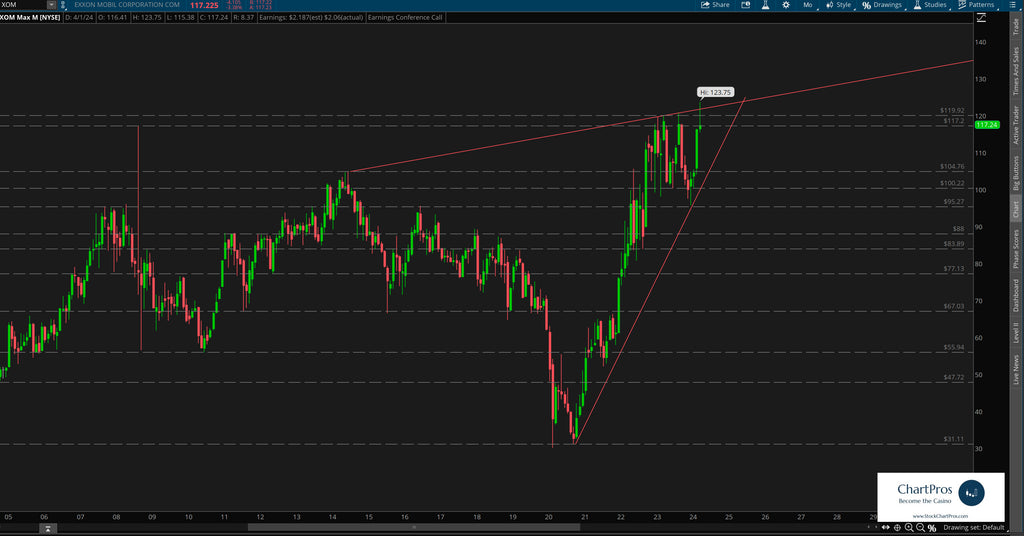
On the monthly chart we've plotted what we consider a "basic structure" chart, meaning the chart only includes support/resistance and trend lines. This is always our first step when charting anything.
We can see price quickly retreating from its fresh $123.75 all time high (ATH) set earlier this month and falling back towards familiar price levels.
Weekly Chart

On the weekly chart we can see with much more clarity the descent from the new ATHs back towards previous support/resistance and a longer term up trend line.
We've also layered in Bull Fibonacci levels to use as potential levels of interest and/or future price targets.
Armed with precision oriented charts like these both traders and investors can formulate their respective plans.
So what's next?
We don't make predictions...
Nobody knows for sure but using these 5 price action tools traders and investors can develop levels of interest in both directions.
- Support/Resistance
- Trend
- Fibonacci
- Supply/Demand Zones,
- Change Control Zones
ChartPros provides the exact methodology in its price action technical analysis courses to create charts like this with the most precise and accurate levels from which investors and traders can formulate their respective trade plans.
Take a look at the charts and let us know what you think.
We'd like to hear from you in the comments sections.
