April 29 Chart of the Day - Franklin Templeton
Precision oriented price action technical analysis by far provides the best edges and most setups for traders across the markets so that's what we use for the basis of our reviews.
Franklin Resources, Inc. (BEN) is a multinational holding company that, together with its subsidiaries, is referred to as Franklin Templeton; it is a global investment firm founded in New York City in 1947.
The firm reported earnings before market open today and is currently trading down over 5% so we wanted to review their chart from a price action technical analysis perspective.
Monthly Chart
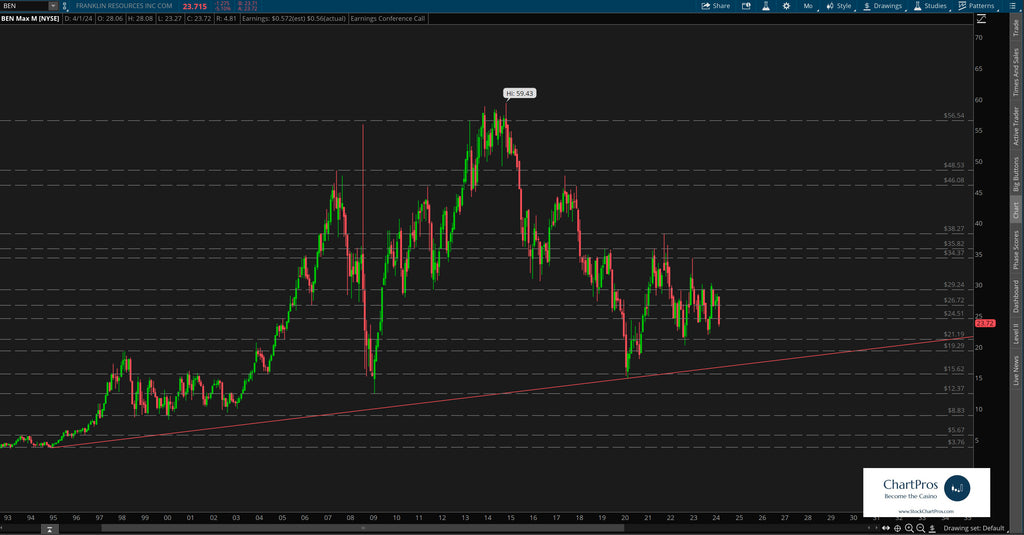
On the monthly chart we can see over 35+ years worth of historical price action in which case more data is typically better.
We've plotted only support/resistance and trend. A concept we call a "basic structure" chart. It's one of the first steps in learning price action charting and trading and when traders can become consistent and confident with this approach we've seen that much can happen on the positive side in the future.
Weekly Chart
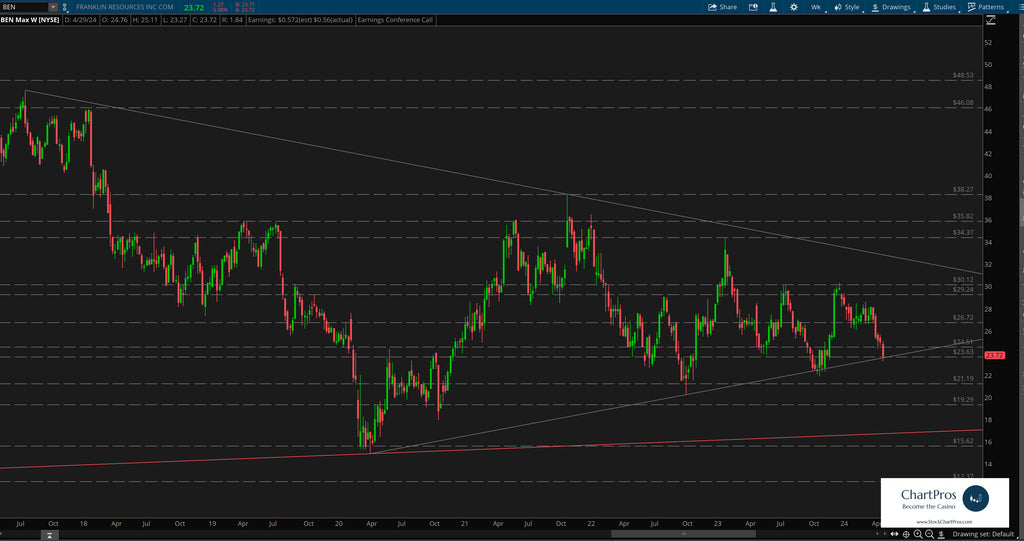
On the weekly chart we can see with much more clarity the level to level price moves and the formation of a "wedge" as outlined with the gray trend lines.
Traders tend to over think things and clutter their charts with unnecessary indicators, studies, and lines of confusion...
Often times when it comes to charting, less is more!
Armed with precision oriented charts like these both traders and investors can formulate their respective plans.
So what's next?
We don't make predictions...
Nobody knows for sure but using these 5 price action tools traders and investors can develop levels of interest in both directions.
- Support/Resistance
- Trend
- Fibonacci
- Supply/Demand Zones,
- Change Control Zones
ChartPros provides the exact methodology in its price action technical analysis courses to create charts like this with the most precise and accurate levels from which investors and traders can formulate their respective trade plans.
Take a look at the charts and let us know what you think.
We'd like to hear from you in the comments sections.
