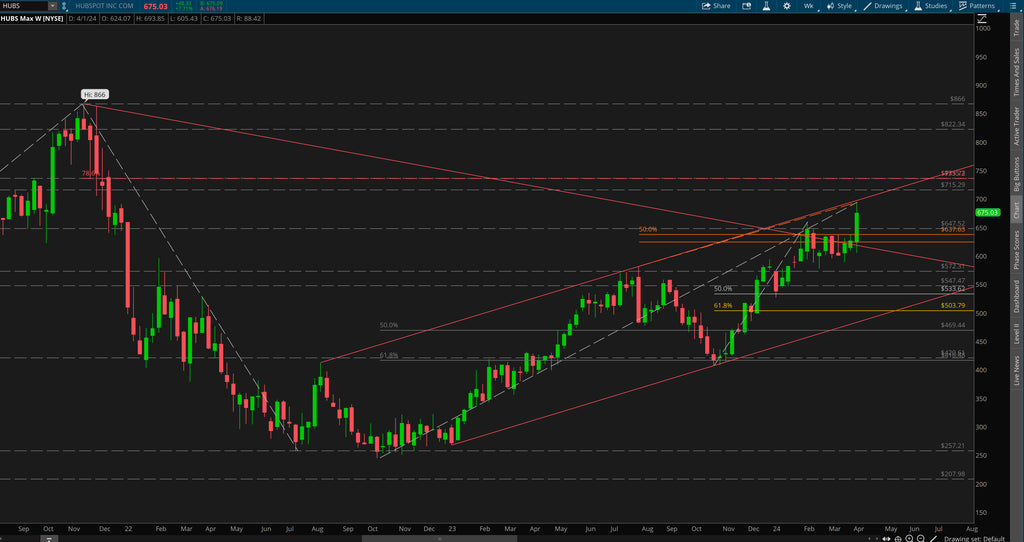
April 4 Chart of the Day - HubSpot
Precision oriented price action technical analysis by far provides the best edges and most setups for traders across the markets so that's what we use for the basis of our reviews.
HubSpot, Inc. (HUBS) is in the headlines today because published reports stated that Google's parent Alphabet has been talking to its advisers about the possibility of making an offer for HubSpot, an online marketing software company with a market value of $35 billion, people familiar with the matter said.
As one could imagine, this drove the company's stock price up in early trading today so we wanted to review their chart from a price action technical analysis perspective.
Monthly Chart

On the monthly chart we noticed that price has respected previous structure and Fibonacci levels however, the retracements in both direction have been very deep.
Price is currently working its way back up towards all time highs (ATH) but has some overhead resistance to get through before reaching those levels again.
Weekly Chart

On the weekly chart we can see the deep retracement and volatility with much more clarity.
We've layered in Fibonacci in both directions as well as a trending channel to help identify potential levels of interest.
Armed with precision oriented charts like these both traders and investors can formulate their respective plans.
So what's next?
We don't make predictions...
Nobody knows for sure but using these 5 price action tools traders and investors can develop levels of interest in both directions.
- Support/Resistance
- Trend
- Fibonacci
- Supply/Demand Zones,
- Change Control Zones
ChartPros provides the exact methodology in its price action technical analysis courses to create charts like this with the most precise and accurate levels from which investors and traders can formulate their respective trade plans.
Take a look at the charts and let us know what you think.
We'd like to hear from you in the comments sections.

