April 8 Chart of the Day - EUR/JPY
Precision oriented price action technical analysis by far provides the best edges and most setups for traders across the markets so that's what we use for the basis of our reviews.
The EUR/JPY is the currency pair encompassing the European Union’s single currency, the euro (symbol €, code EUR), and the Japanese yen of Japan (symbol ¥, code JPY).
It's one of the most frequently requested Forex charts we get.
The pair’s rate indicates how many Japanese yen are needed in order to purchase one euro. When the EUR/JPY is trading at 125.00, it means 1 euro is equivalent to 125 Japanese yen.
The euro (EUR) is the world’s second most traded currency, while the Japanese yen (JPY) is the world’s third most traded currency, resulting in an extremely liquid pair.
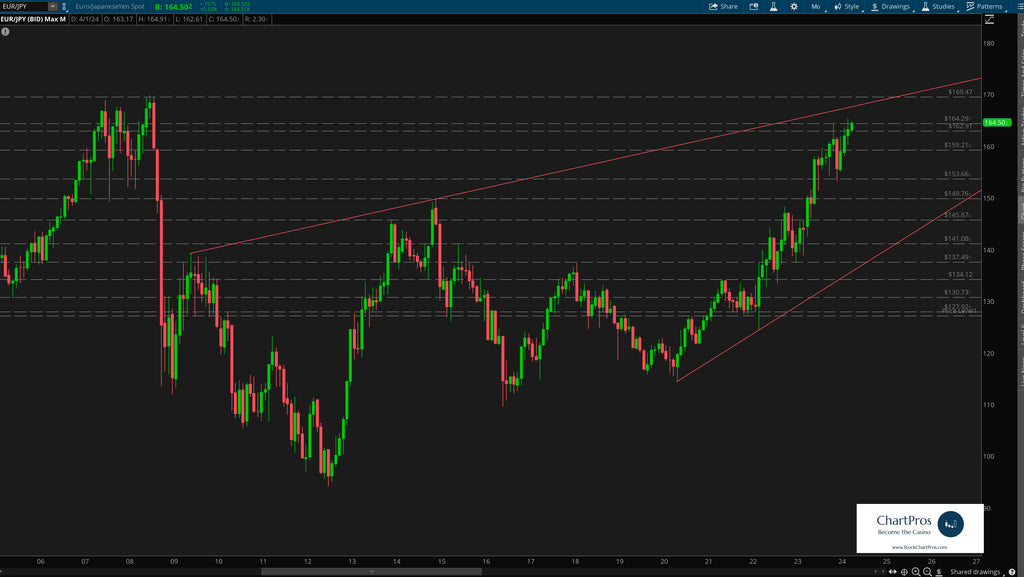
Price has been consistently making a series of higher highs and higher lows during the past decade and recently broke above long time resistance at 164 reaching levels not seen in about 15 years.
From a price action technical analysis perspective this chart routinely provides nice pull back long opportunities but the question remains can the upward trend continue and if so for how long?
Monthly Chart - Support/Resistance and Trend Only
Weekly Chart

Down on the weekly chart we can see the up trend with even more clarity and using a very helpful trend tool, Fibonacci, various potential pull back long levels of interest.
Ultimately, the question we attempt to answer in all cases is "where could price go?"
Armed with precision oriented charts like these both traders and investors can formulate their respective plans.
So what's next?
We don't make predictions...
Nobody knows for sure but using these 5 price action tools traders and investors can develop levels of interest in both directions.
- Support/Resistance
- Trend
- Fibonacci
- Supply/Demand Zones,
- Change Control Zones
ChartPros provides the exact methodology in its price action technical analysis courses to create charts like this with the most precise and accurate levels from which investors and traders can formulate their respective trade plans.
Take a look at the charts and let us know what you think.
We'd like to hear from you in the comments sections.
