February 29 Chart of the Day - Autodesk
Precision oriented price action technical analysis by far provides the best edges and most setups for traders across the markets so that's what we use for the basis of our reviews.
Autodesk (ADSK) creates software products and services for the architecture, engineering, construction, manufacturing, media, education, and entertainment industries.
The company reports earnings after market close today so we wanted to review their chart from a price action technical analysis perspective.
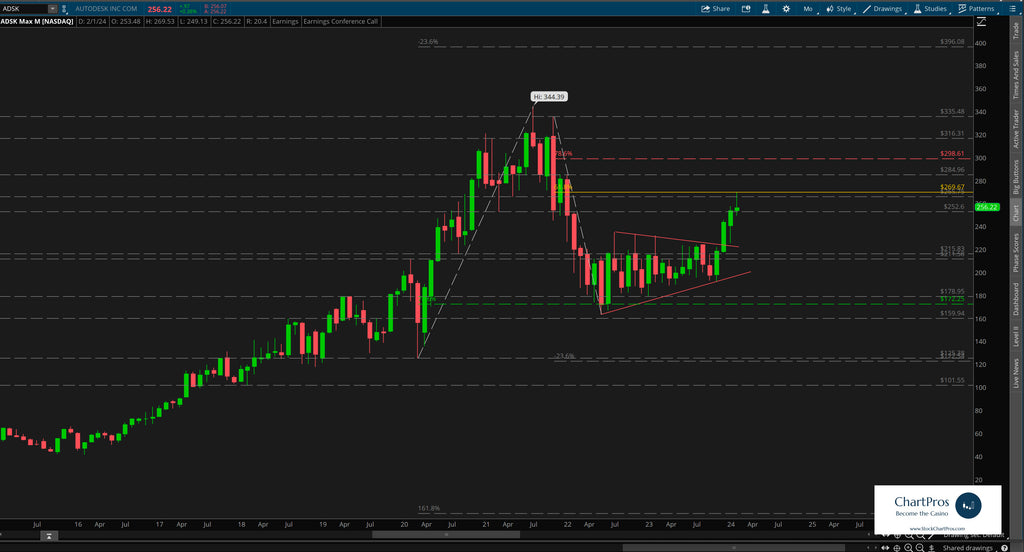
On the monthly chart we can see that price recently broke out of a long consolidation / wedge formation and is retracing up towards its $344.39 all time high (ATH) set back in 2021.
Price met resistance in the $270 area and faded to the $256 level where it was trading earlier today.
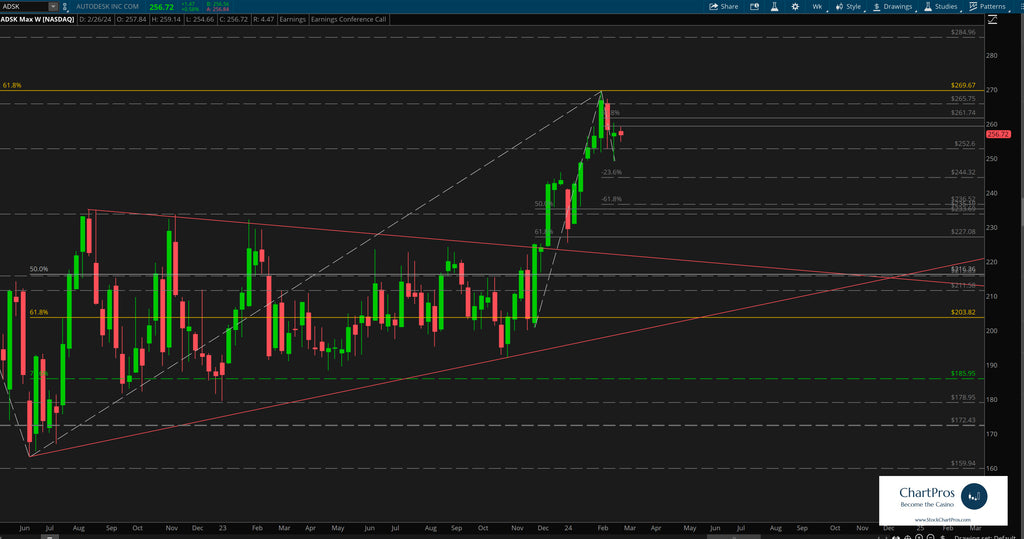
On the weekly chart we can see with more clarity by using Fibonacci and additional support/resistance levels where price began its recent fall and the potential levels it could be going towards.
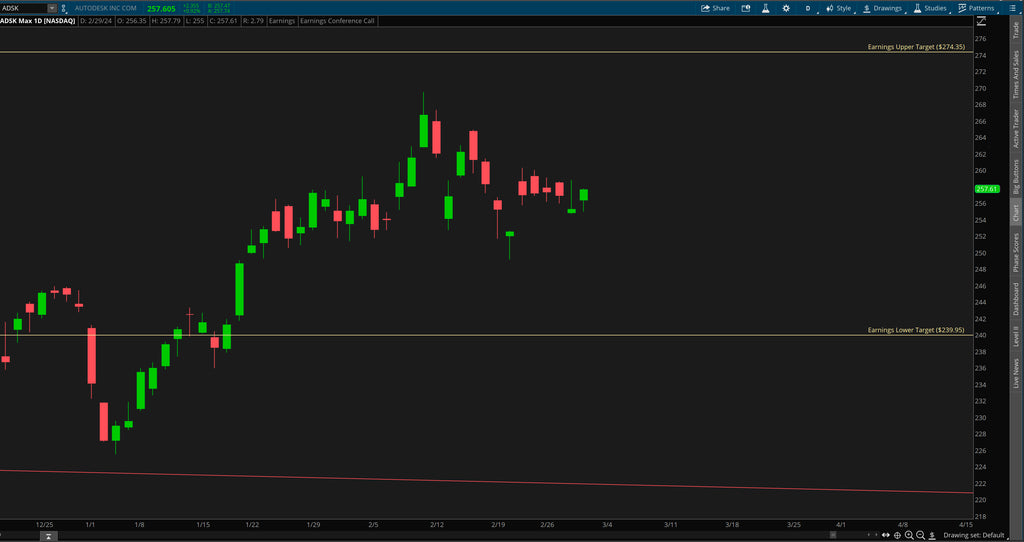
And just for earnings we'll take a look at the daily chart and use the at the money (ATM) straddle cost that expires this Friday to determine potential upper and lower price targets. The market is implying about a $17.50 move in either direction so that indicates to us quite a significant move in a short amount of time.
Armed with this precision oriented information both traders and investors can formulate their respective plans.
So what's next?
We don't make predictions...
Nobody knows for sure but using these 5 price action tools traders and investors can develop levels of interest in both directions.
- Support/Resistance
- Trend
- Fibonacci
- Supply/Demand Zones,
- Change Control Zones
ChartPros provides the exact methodology in its price action technical analysis courses to create charts like this with the most precise and accurate levels from which investors and traders can formulate their respective trade plans.
Take a look at the charts and let us know what you think.
We'd like to hear from you in the comments sections.
Have a chart you'd like to see featured?
Send requests at https://stockchartpros.com/community/contact
Would you like charts like this delivered directly to you every day? ChartPros Trade Room is offering an OPEN HOUSE 7-day free trial at this link.
Experience a Week In the Life of a ChartPros Trade Room Member!