July 19 Chart of the Day - Carvana
Carvana (CVNA) stock spiked as much as 27% in pre-market trading on Wednesday after the online care retailer announced a deal to restructure its debt and adjusted profits that beat analyst expectations before the opening bell.
What seems to be peculiar about this is the company wasn't scheduled to report earnings until August. But, they made an announcement just yesterday that earnings would be released today which sent the stock down about 10% on the day.
Note to self - anytime a company changes its earnings date there's probably some big news driving it...
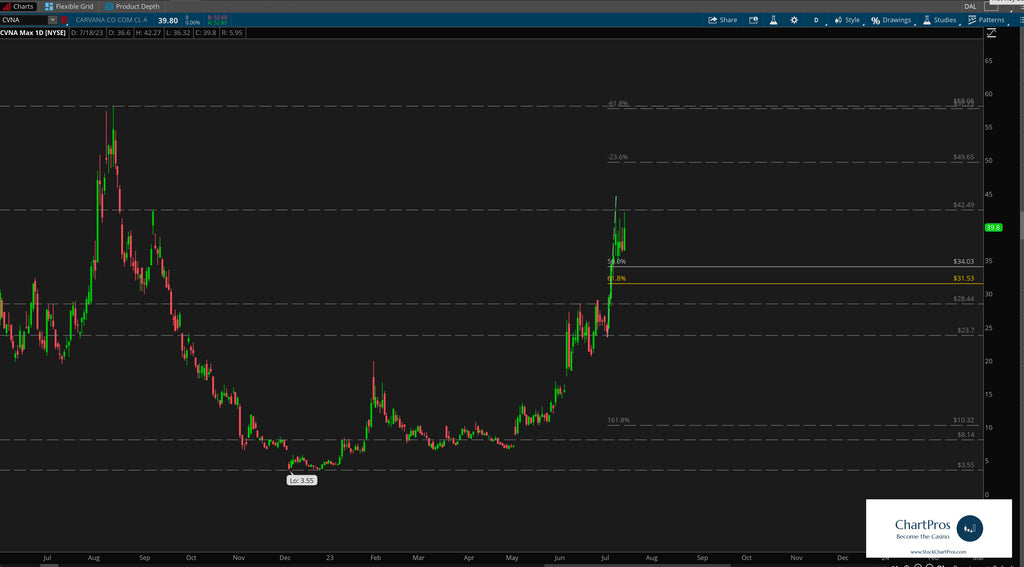
So after selling off to the $35 area yesterday price is trading near $58 in pre-market trading which from a price action technical analysis perspective is a major resistance level.
After reaching its all time high of $376.83 in August of 2021 the stock plummeted all the way down to $3.55 in December of 2022. Since then, price has been making a series of higher highs and higher lows.
So what's next?
Nobody knows for sure but using these 5 price action tools traders and investors can develop levels of interest in both directions.
- Support/Resistance
- Trend
- Fibonacci
- Supply/Demand Zones,
- Change Control Zones
Take a look at the charts and let us know what you think.
We'd like to hear from you in the comments sections.
Have a chart you'd like to see featured?
Send requests at https://stockchartpros.com/community/contact
Would you like charts like this delivered directly to you every day? ChartPros Trade Room is offering an OPEN HOUSE 7-day free trial at this link.