June 2 Chart of the Day - Natural Gas
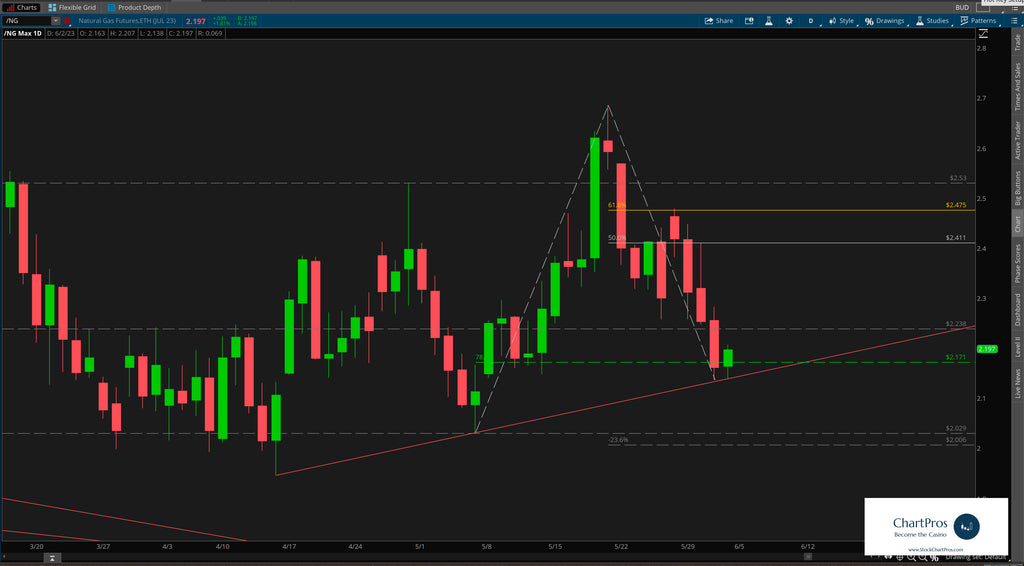
Natural Gas /aka/ "Natty" ticker /NG has fallen over 65% since last Thanksgiving and has been melting through possible support levels but may have found its footing in the last 6-8 weeks.
Since reaching 1.946 on April 14, price has made a series of higher highs and higher lows and is on the rise today.
Does that mean the low has been established? Possibly, but price continues to make volatile moves on the daily chart.
If the new found up trend continues 2.4 - 2.6 and beyond may be on the short term horizon.
However, if the bulls don't hold serve then 1.8 is a potential downside target.
So what's next?
Nobody knows for sure but using these 5 price action tools traders and investors can develop levels of interest in both directions.
- Support/Resistance
- Trend
- Fibonacci
- Supply/Demand Zones,
- Change Control Zones
Take a look at the charts and let us know what you think.
We'd like to hear from you in the comments sections.
Have a chart you'd like to see featured?
Send requests at https://stockchartpros.com/community/contact
Would you like charts like this delivered directly to you every day? ChartPros Trade Room is offering a 7-day free trial at this link.