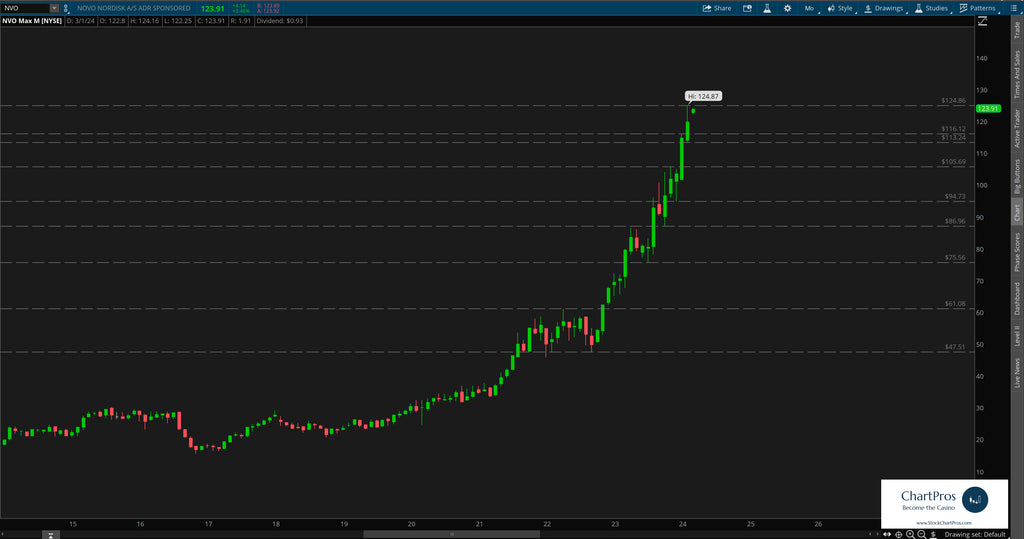
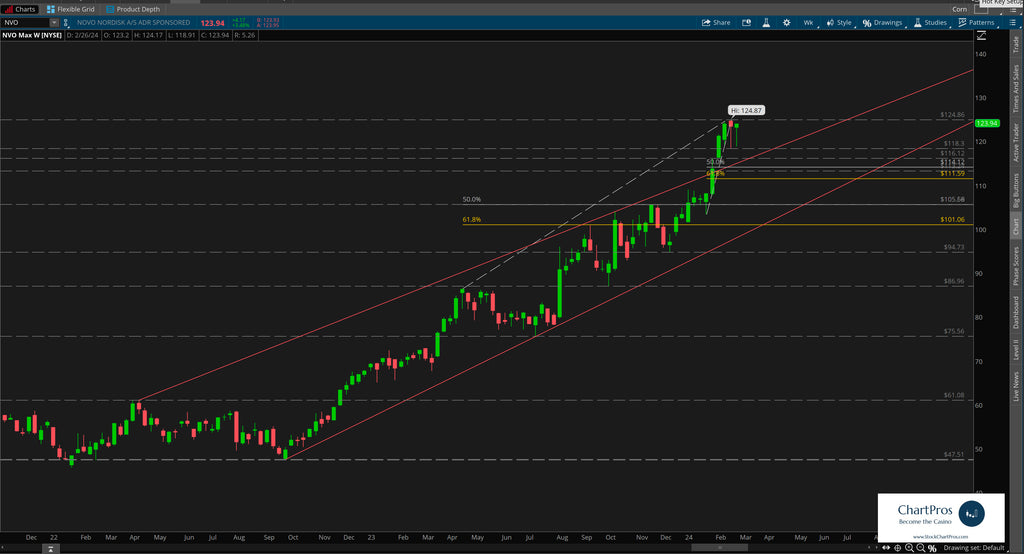
March 1 Chart of the Day - Novo Nordisk
Precision oriented price action technical analysis by far provides the best edges and most setups for traders across the markets so that's what we use for the basis of our reviews.
Makers of diabetes prescription drug Ozempic (weight loss), Norvo Nordisk (NVO) has been one of the most requested charts during the past several weeks.
We've been putting off our review simply because price continues to make new all time highs (ATH) week after week but today we'll apply price action technical analysis to determine if there are any potential pull back levels where investors or traders could possibly enter.
With that said here are just the charts...
Monthly


Armed with this precision oriented information both traders and investors can formulate their respective plans.
So what's next?
We don't make predictions...
Nobody knows for sure but using these 5 price action tools traders and investors can develop levels of interest in both directions.
- Support/Resistance
- Trend
- Fibonacci
- Supply/Demand Zones,
- Change Control Zones
ChartPros provides the exact methodology in its price action technical analysis courses to create charts like this with the most precise and accurate levels from which investors and traders can formulate their respective trade plans.
Take a look at the charts and let us know what you think.
We'd like to hear from you in the comments sections.
Have a chart you'd like to see featured?
Send requests at https://stockchartpros.com/community/contact
Would you like charts like this delivered directly to you every day? ChartPros Trade Room is offering an OPEN HOUSE 7-day free trial at this link.
Experience a Week In the Life of a ChartPros Trade Room Member!
