March 11 Chart of the Day - Davita
Precision oriented price action technical analysis by far provides the best edges and most setups for traders across the markets so that's what we use for the basis of our reviews.
DaVita Inc (DVA), is a provider of dialysis and integrated health care management services. They also are reported to be one of Warren Buffet's top holdings so we wanted to review their chart from a price action technical analysis perspective.
At first glance we found that price was essentially trading at all time highs (ATH) and wasn't all that surprised especially because the Oracle of Omaha is involved.
We almost didn't review the chart because of all time highs but we decided we'd use the price action tools, Fibonacci and trend, that are able to help identify upside targets. Even when there's no historical price information at those levels.
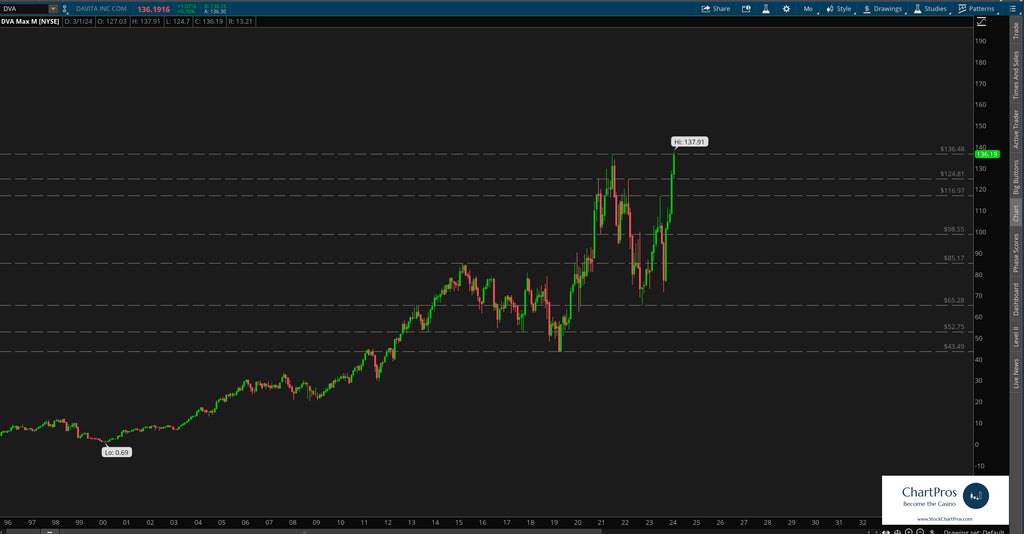
So initially we built a monthly "basic structure" chart using only support and resistance as seen below.
Monthly Basic Structure Chart
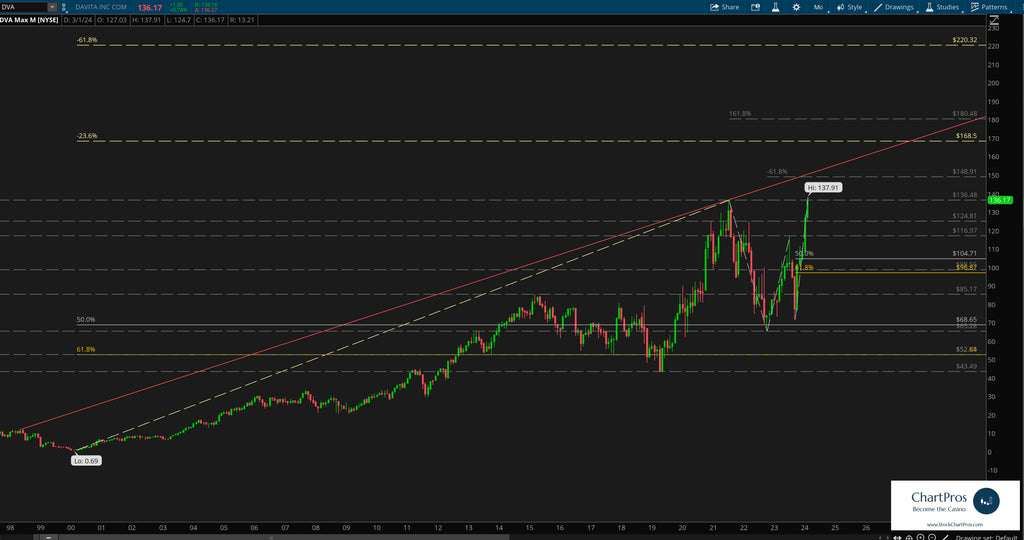
Monthly Chart with potential upside targets
Next, we decided to stay on the monthly chart and layer on Fibonacci and trend to help build anticipated upside targets as seen in the next monthly chart.
We've also layered in Fibonacci bull retracements in the event price decides it wants to fade from its current price level.
Armed with this precision oriented information both traders and investors can formulate their respective plans.
So what's next?
We don't make predictions...
Nobody knows for sure but using these 5 price action tools traders and investors can develop levels of interest in both directions.
- Support/Resistance
- Trend
- Fibonacci
- Supply/Demand Zones,
- Change Control Zones
ChartPros provides the exact methodology in its price action technical analysis courses to create charts like this with the most precise and accurate levels from which investors and traders can formulate their respective trade plans.
Take a look at the charts and let us know what you think.
We'd like to hear from you in the comments sections.