March 12 Chart of the Day - Abbott Laboratories
Precision oriented price action technical analysis by far provides the best edges and most setups for traders across the markets so that's what we use for the basis of our reviews.
Abbott Laboratories (ABT) is a S&P 500 company that manufacturers many popular products in the therapeutic areas of cardiovascular, diabetes, diagnostics, neuromodulation, nutrition and pharmaceuticals. Some of its well-known brands include Similac, PediaSure, Pedialyte, Brufen, Klacid, Alinity, Ensure, FreeStyle, iStat and MitraClip.
Abbott is often in the headlines for various reasons so today we wanted to review their chart from a price action technical analysis perspective.
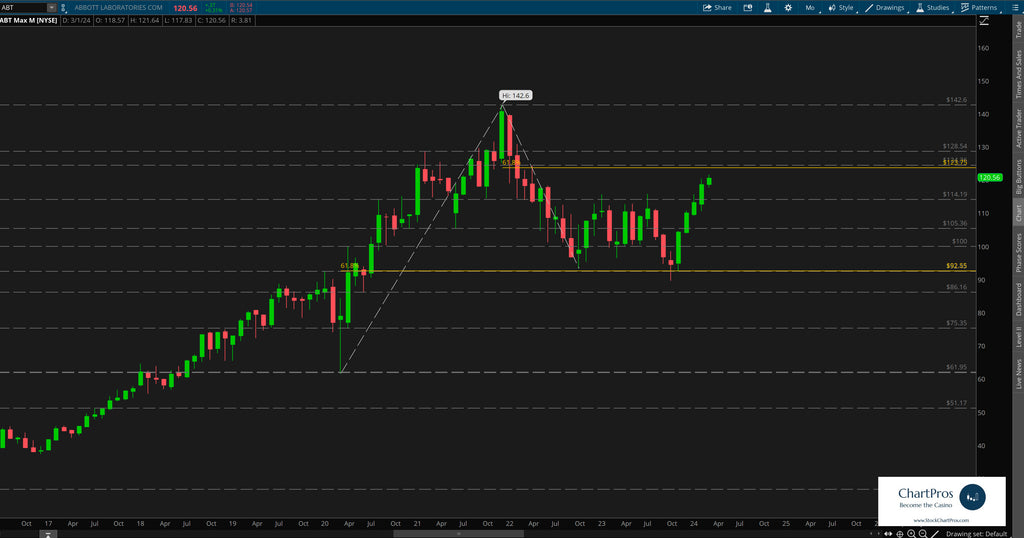
On the monthly chart we can see that there is decades of historical information which is helpful when creating a price action chart. However, what we found to be most useful occurred since 2020.
Since then price has been making a series of higher highs and higher lows establishing a $142.60 all time high (ATH)
Currently trading around $120 price is off its ath but also well above a definitive last low it set at $61.95. In fact, the last 2 to 3 years price as essentially been trading between $92 and $123 of which its seemingly approaching and may have a decision to make of whether to continue on its upward march or fade back to the downside.
Monthly Chart
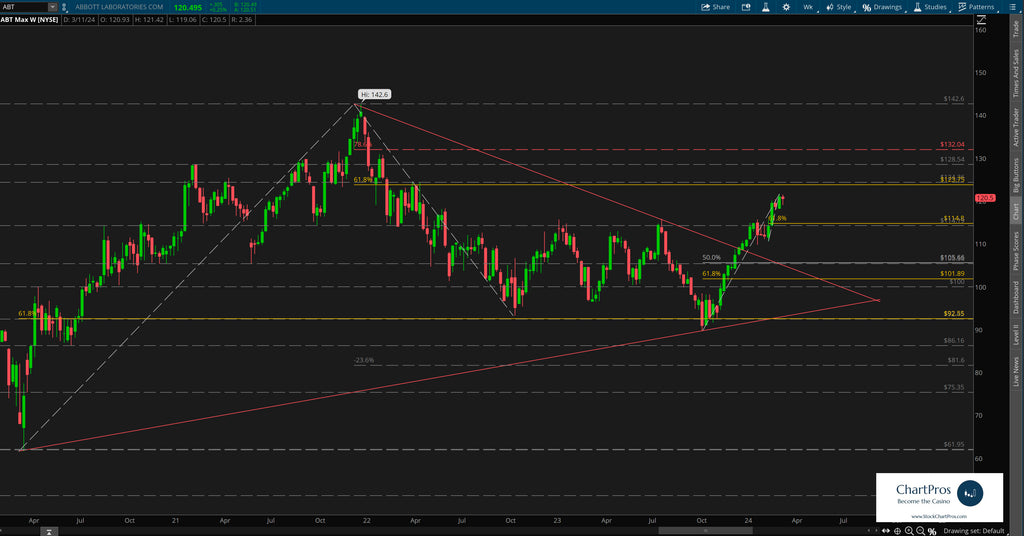
Weekly Chart
Down on the weekly chart we can clearly see the uptrend and recent break out from a wedge pattern that developed within the trend lines.
We can also see the potential overhead resistance in the form of a bear 61.8% Fibonacci retracement and support/resistance.
We've also layered in Fibonacci bull retracements in the event price decides it wants to fade from its current price level and possibly present a "pull back long opportunity."
Armed with this precision oriented information both traders and investors can formulate their respective plans.
So what's next?
We don't make predictions...
Nobody knows for sure but using these 5 price action tools traders and investors can develop levels of interest in both directions.
- Support/Resistance
- Trend
- Fibonacci
- Supply/Demand Zones,
- Change Control Zones
ChartPros provides the exact methodology in its price action technical analysis courses to create charts like this with the most precise and accurate levels from which investors and traders can formulate their respective trade plans.
Take a look at the charts and let us know what you think.
We'd like to hear from you in the comments sections.