March 13 Chart of the Day - MongoDB
Precision oriented price action technical analysis by far provides the best edges and most setups for traders across the markets so that's what we use for the basis of our reviews.
MongoDB (MDB) provides an advanced scalable general purpose database software platform that uses hybrid open-source and proprietary technology as the basis for its 'freemium' software business model. MongoDB was founded in November 2007 and made its initial public offering at $24 per share in October 2017.
Today we wanted to review their chart from a price action technical analysis perspective because the company reported earnings on March 7 that beat revenue estimates but fell shy of profit estimates in which the stock promptly sold off...
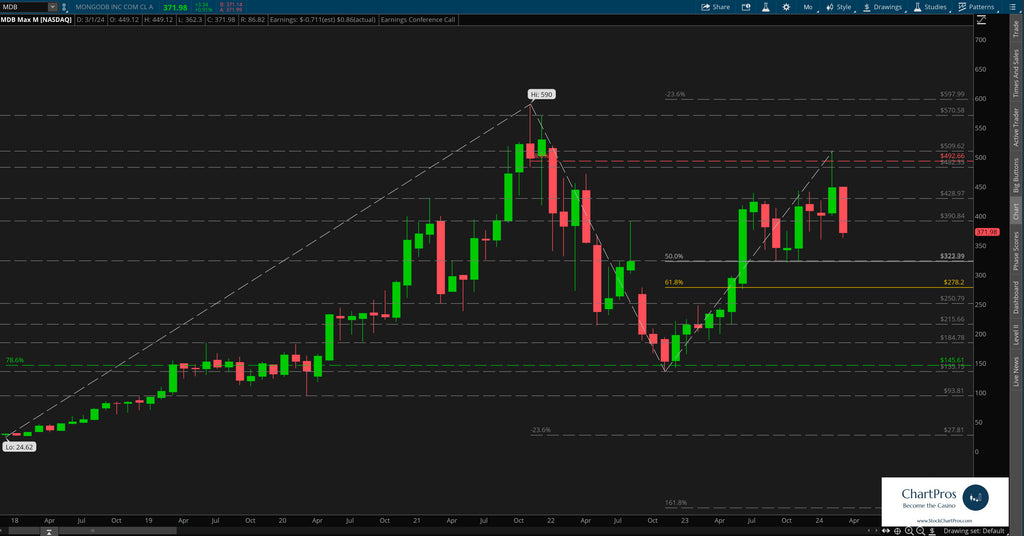
On the monthly chart we can see that since the 2017 IPO price has been going through somewhat of a "price discovery" phase but moving in a technically correct manner so far.
For example, after making its $590 all time high (ATH) back in 2022 price swiftly but orderly fell all the way down to the $135 area which happened to coincide with prior support / resistance and a 78.6% bull retracement level.
Since then price made a series of higher highs and higher lows until running into another prior support / resistance level and a 78.6% bear retracement level.
Monthly Chart
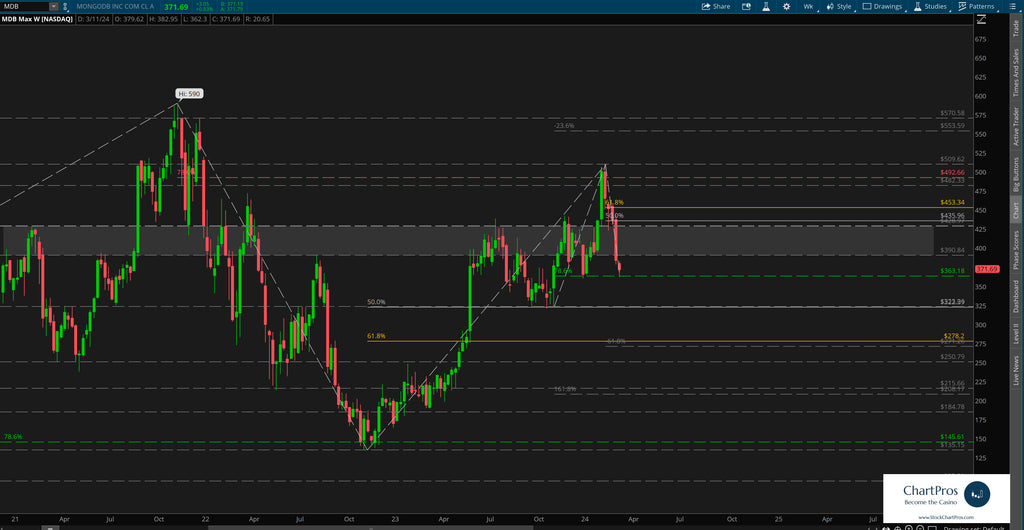
Down on the weekly chart we can clearly see the uptrend that recently crossed above and then back below a developing change control zone roughly between $390 and $425 (gray shaded rectangle)
Change control zones are one of the five price action tools we teach when charting anything. By definition, they are an area that represents where neither the bulls nor bears are in charge. Price can slash though the zone with seemingly reckless abandon, price can respect the top or bottom from outside it or within it. Or, price can trade aimlessly sideways within it. When price breaks away from the zone it can often get drawn back to it like a magnet. And in this case we see all of the above are true.
In fact, price has crossed this zone 15 times during the past 2+ years or so.
We've also layered in Fibonacci bull retracements in the event price decides it wants to continue falling from its current price level to possibly present a "pull back long opportunity" or if price decides to cross the zone yet again we've added bear Fibonacci retracement levels from the last interim high.
Armed with this precision oriented information both traders and investors can formulate their respective plans.
Weekly Chart
So what's next?
We don't make predictions...
Nobody knows for sure but using these 5 price action tools traders and investors can develop levels of interest in both directions.
- Support/Resistance
- Trend
- Fibonacci
- Supply/Demand Zones,
- Change Control Zones
ChartPros provides the exact methodology in its price action technical analysis courses to create charts like this with the most precise and accurate levels from which investors and traders can formulate their respective trade plans.
Take a look at the charts and let us know what you think.
We'd like to hear from you in the comments sections.