March 14 Chart of the Day - Tesla
Precision oriented price action technical analysis by far provides the best edges and most setups for traders across the markets so that's what we use for the basis of our reviews.
Tesla (TSLA) has been one of the most requested charts in recent memory because of the constant selling pressure and traders and investors trying to find the bottom.
We don't call tops/bottoms but we do review charts from a price action technical analysis perspective.
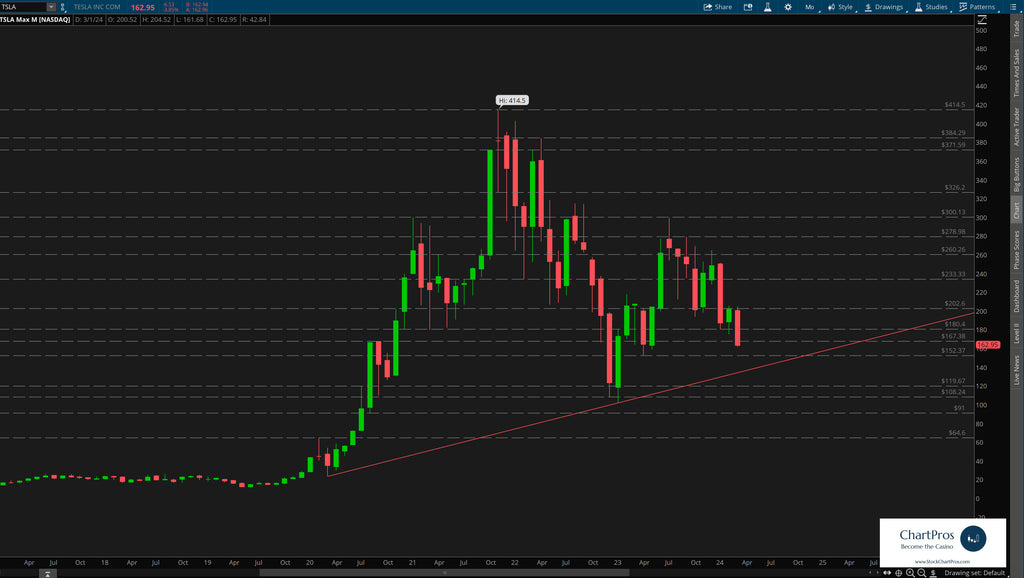
We'll start on the monthly chart using only support/resistance and trend. We like to call this a "basic structure" chart and yes contrary to popular opinion you can trade simply using these two price action tools!
Regardless of anyone's bullish or bearish opinions we can see price has historically created and respected support/resistance levels. Is it ever in a straight shot? No.
Are we buyers of Tesla using this chart?
Not with additional support/resistance and trend down below.
Monthly Chart
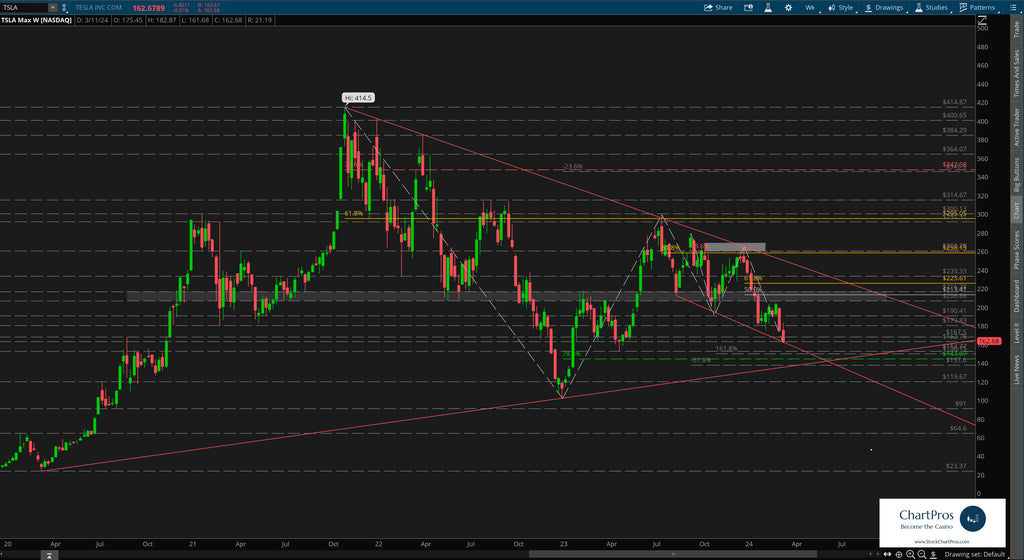
Down on the weekly chart we can clearly see the down trend that started last summer. Price has melted through several potential support layers still seeking a bottom.
Price could potentially get a relief bounce in this area as there's a confluence of support/resistance and trend. But it's also possible that price totally ignores this structure too.
Weekly Chart
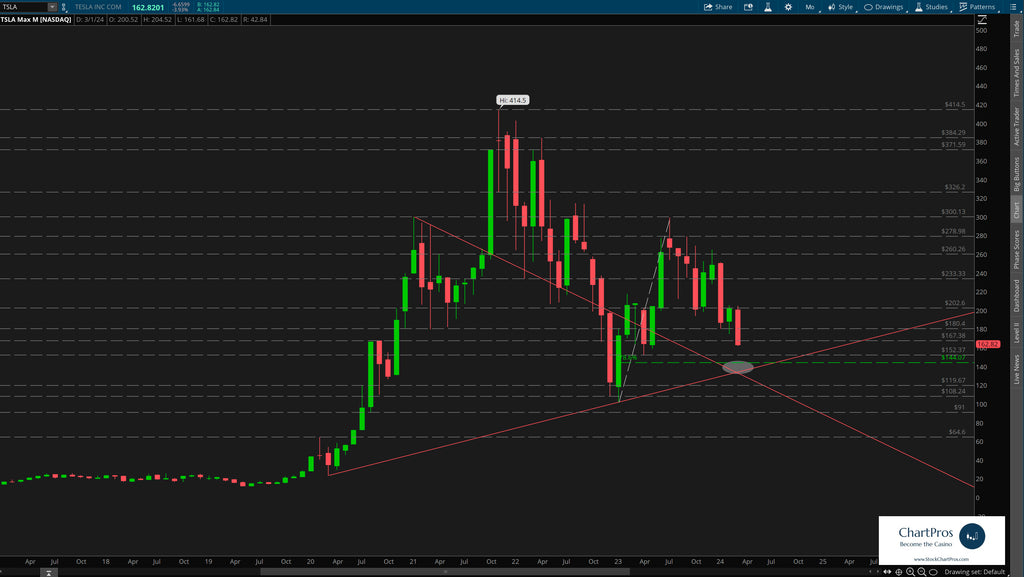
Putting it all together
When formulating a trade plan we'll often combine structure found across multiple time frames and in this case we've done it on another monthly view.
If price continues to melt down we've identified a possible "last chance" area for the Tesla bulls. If this area were to fail, well you can see the support / resistance levels down below there that could be the next potential targets.
So what's next?
We don't make predictions...
Nobody knows for sure but using these 5 price action tools traders and investors can develop levels of interest in both directions.
- Support/Resistance
- Trend
- Fibonacci
- Supply/Demand Zones,
- Change Control Zones
ChartPros provides the exact methodology in its price action technical analysis courses to create charts like this with the most precise and accurate levels from which investors and traders can formulate their respective trade plans.
Take a look at the charts and let us know what you think.
We'd like to hear from you in the comments sections.