March 18 Chart of the Day - Beyond, Inc.
Precision oriented price action technical analysis by far provides the best edges and most setups for traders across the markets so that's what we use for the basis of our reviews.
Beyond, Inc. (BYON) is an online retailer previously known as Overstock.com, the company acquired and adopted the name of bankrupt big-box retailer Bed Bath & Beyond in 2023. The company sells home decor, furniture, bedding, and many other goods that are closeout merchandise.
Marcus Lemonis, a retail veteran best known for reviving struggling businesses on CNBC’s “The Profit,” became Beyond’s executive chairman last month and promptly acquired what was the defunct Zulily brand for $4.5 million. The acquisition includes certain intellectual property assets, the Zulily website and domain names, customer database and social media accounts, among other items.
“We’re excited about the global vendor pool this acquisition opens the door to, driving incremental revenue by reengaging Zulily’s 18 million customers as well as the existing Beyond customer database with significant synergies across product categories,” he said.
Being a big fan of Lemonis and his successful track record we'll take a look at their chart from a price action technical analysis perspective.
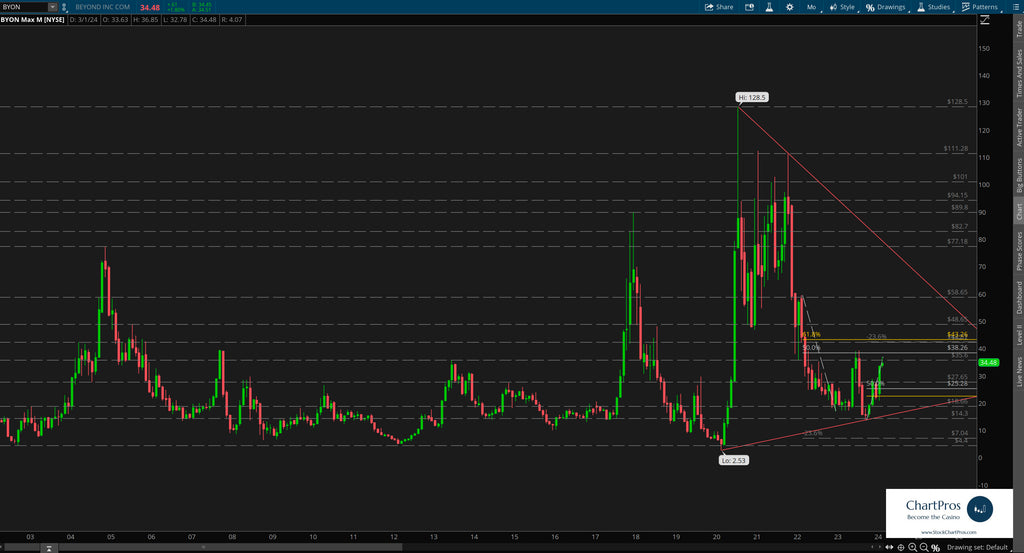
On the monthly chart we can see extreme volatility since the global pandemic with price making its $128.50 all time high (ATH) back in 2020.
Since then a lot of selling pressure came in where the Beyond bulls simply were not present with price falling all the way down to the $15 area just a few short months ago.
Price seemingly got a relief bounce around the time Lemonis was brought in and is attempting to make a higher high. Trading around $34 earlier today price may have an upcoming decision to make that we'll further anlalyze on the weekly chart.
Monthly Chart
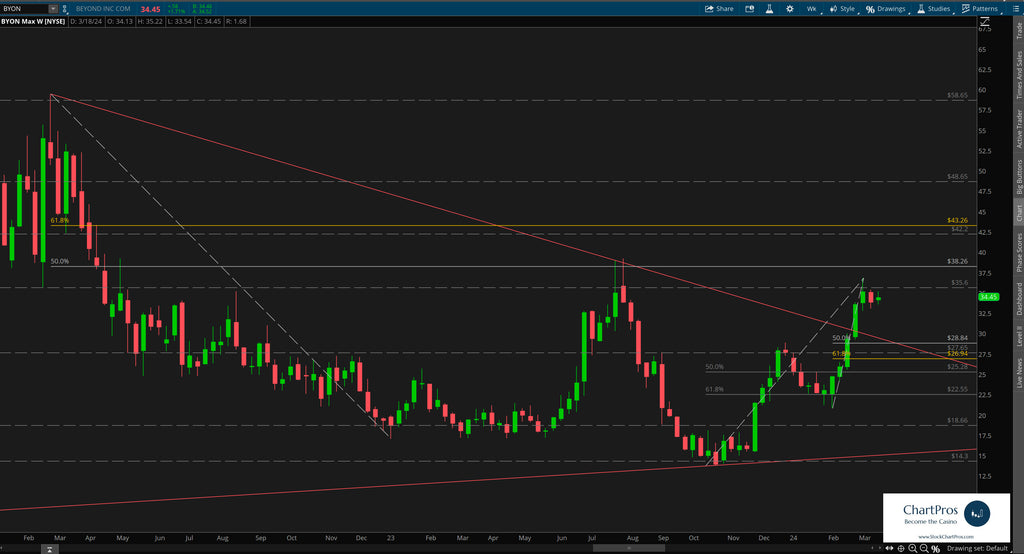
On the weekly chart we can see with more clarity price attempting to break the higher time frame down trend with a series of higher highs and higher lows.
We've layered in bull Fibonacci sequencing identifying potential pull back long levels of interest should price decide to continue this new up trend. Should price not pull back and simply continue upwards we've used bear Fibonacci levels to identify possible price targets.
Armed with this precision oriented information both traders and investors can formulate their respective plans.
Weekly Chart
So what's next?
We don't make predictions...
Nobody knows for sure but using these 5 price action tools traders and investors can develop levels of interest in both directions.
- Support/Resistance
- Trend
- Fibonacci
- Supply/Demand Zones,
- Change Control Zones
ChartPros provides the exact methodology in its price action technical analysis courses to create charts like this with the most precise and accurate levels from which investors and traders can formulate their respective trade plans.
Take a look at the charts and let us know what you think.
We'd like to hear from you in the comments sections.