March 19 Chart of the Day - AstraZeneca
Precision oriented price action technical analysis by far provides the best edges and most setups for traders across the markets so that's what we use for the basis of our reviews.
AstraZeneca (AZN), a global pharmaceutical provider, is making headlines as it announced its acquisition of Fusion Pharmaceuticals (FUSN), a Canadian drug developer, in an all-cash deal valued at $2 billion. This strategic move aims to bolster AstraZeneca's presence in the oncology space.
Seeing a headline like this we decided to take a look at their chart from a price action technical analysis perspective to see where price could be heading.
Monthly Chart
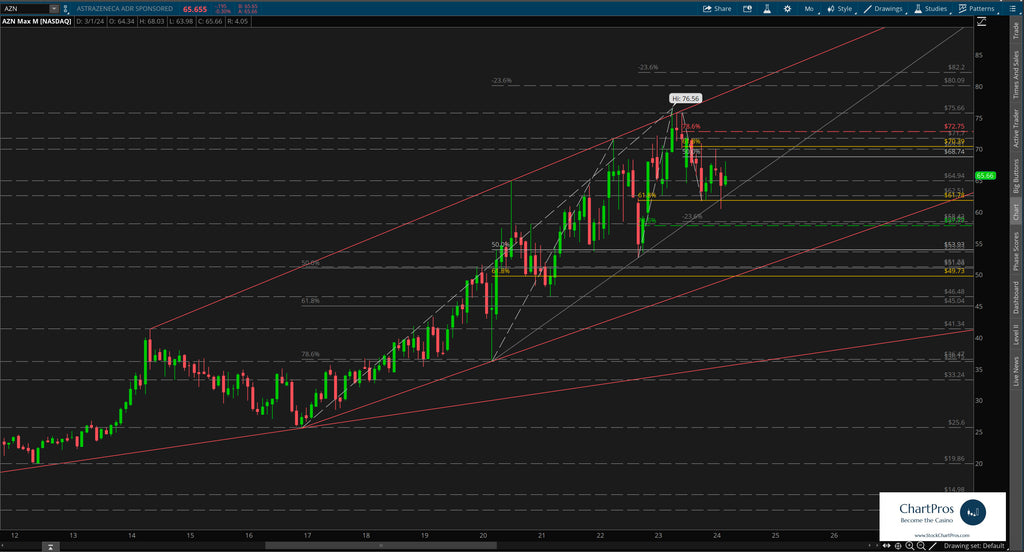
On the monthly chart we can see an uptrend that started back in 2017 with price making a series of higher highs and higher lows however, price is in an area where the updtrend could possibly break.
With the aid of a "trend within a trend" (upward sloping light gray solid line) we can see that price may have an upcoming decision to make.
Weekly Chart
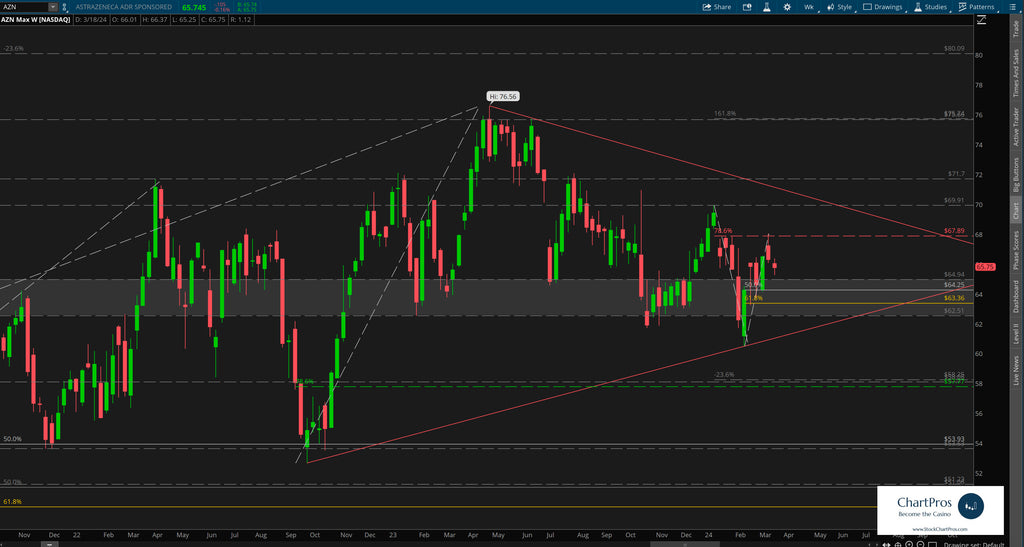
On the weekly chart we can see that price created a change control zone roughly between $62.50 and $65.
Change control zones are one of the five price action tools we teach when charting anything. By definition, they are an area that represents where neither the bulls nor bears are in charge. Price can slash though the zone with seemingly reckless abandon, price can respect the top or bottom from outside it or within it. Or, price can trade aimlessly sideways within it. When price breaks away from the zone it can often get drawn back to it like a magnet. And in this case we see all of the above are true.
Price has crossed this zone 20 times since the summer of 2020 and may be considering it again real soon...
Also on the weekly we can see that since establishing its $76.56 all time high (ATH) about a year ago that price has been making a series of lower highs and lower lows - a down trend.
When an uptrend and a downtrend begin to occur simultaneously we can often see a "wedge" formation on the chart as outlined by the two red trendlines.
Armed with precision oriented charts like these both traders and investors can formulate their respective plans.
So what's next?
We don't make predictions...
Nobody knows for sure but using these 5 price action tools traders and investors can develop levels of interest in both directions.
- Support/Resistance
- Trend
- Fibonacci
- Supply/Demand Zones,
- Change Control Zones
ChartPros provides the exact methodology in its price action technical analysis courses to create charts like this with the most precise and accurate levels from which investors and traders can formulate their respective trade plans.
Take a look at the charts and let us know what you think.
We'd like to hear from you in the comments sections.