March 20 Chart of the Day - S&P 500 before FOMC Meeting
Precision oriented price action technical analysis by far provides the best edges and most setups for traders across the markets so that's what we use for the basis of our reviews.
Today at 2pm eastern the US Federal Reserve will announce its decision on whether or not to change interest rates. The announcement is followed by a press conference with Fed Chair Jay Powell.
Seems like each one of these interest rate, inflation, or employment related news days lately brings with it more and more volatility with the same old question of "how much higher can the markets go?"
The simple answer is as high as they want.
With that in mind we thought we share with you the S&P 500 price action technical analysis chart (ticker /ES on Think or Swim) we shared with our highly rated Trade Room members earlier this morning before market open.
4 Hour Planning Chart - Best Timeframe for Intraday Trading
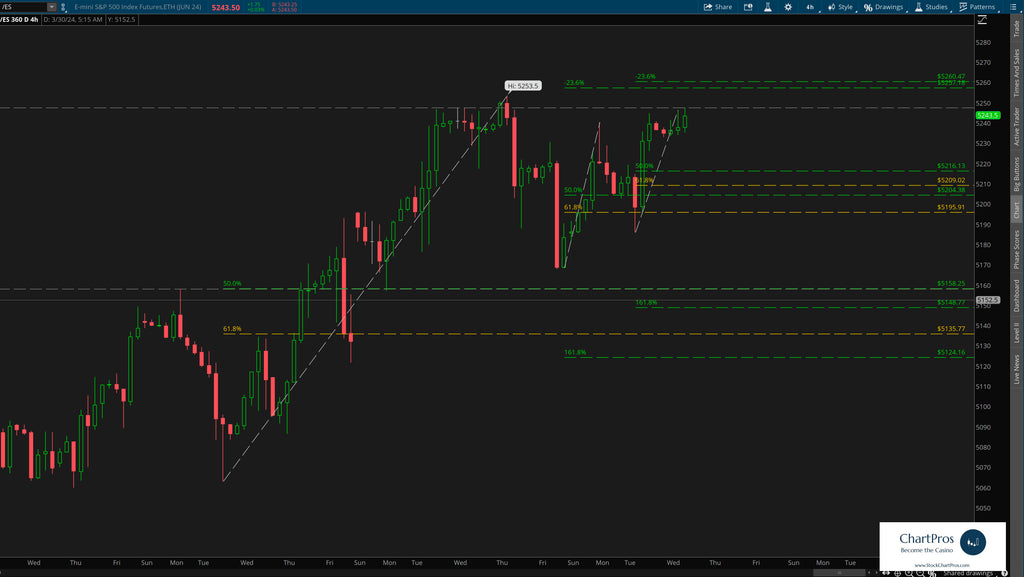
They say "the trend is your friend" (until it isn't) so we've identified 4 hour levels of interest in both directions with an emphasis on pull back long levels because honestly we'd rather be long this chart rather than short until we see evidence that the longer term uptrend is broken.
New for 2024 in our Highly Rated trade room is an INSIDERS VIP Channel where ChartPros Founder Tom Winterstein and other Sr. ChartPros Trade Room Members share their personal charts, thoughts, and analysis. Not only for the S&P 500 but for the entire list of 16 charts our members receive each trading day.
INSIDERS VIP Channel - BONUS Charts and Analysis
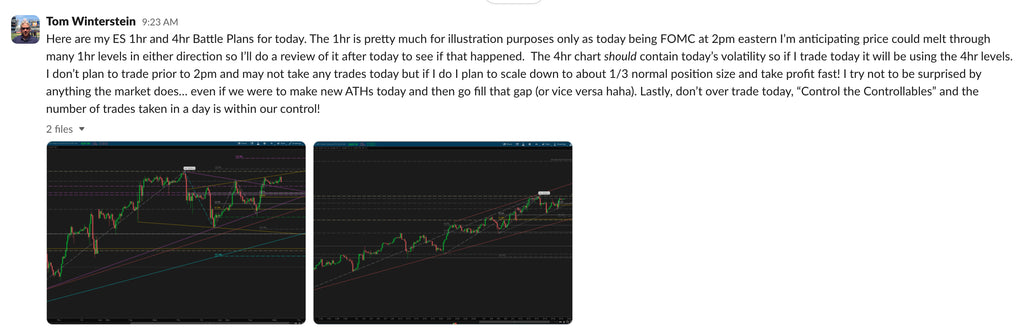
For clarity purposes here is the text of the message and the charts in larger format:
"Here are my ES 1hr and 4hr Battle Plans for today. The 1hr is pretty much for illustration purposes only as today being FOMC at 2pm eastern I’m anticipating price could melt through many 1hr levels in either direction so I’ll do a review of it after today to see if that happened.
The 4hr chart should contain today’s volatility so if I trade today it will be using the 4hr levels. I don’t plan to trade prior to 2pm and may not take any trades today but if I do I plan to scale down to about 1/3 normal position size and take profit fast! I try not to be surprised by anything the market does… even if we were to make new ATHs today and then go fill that gap (or vice versa haha).
Lastly, don’t over trade today, “Control the Controllables” and the number of trades taken in a day is within our control!"
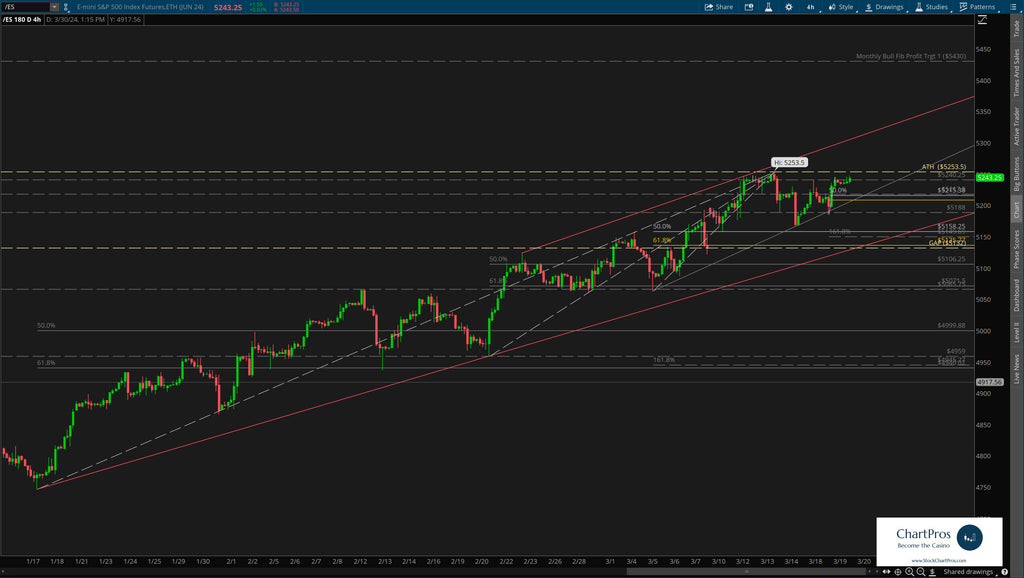
Tom's 4 Hour Personal "Battle Plan" Planning Chart
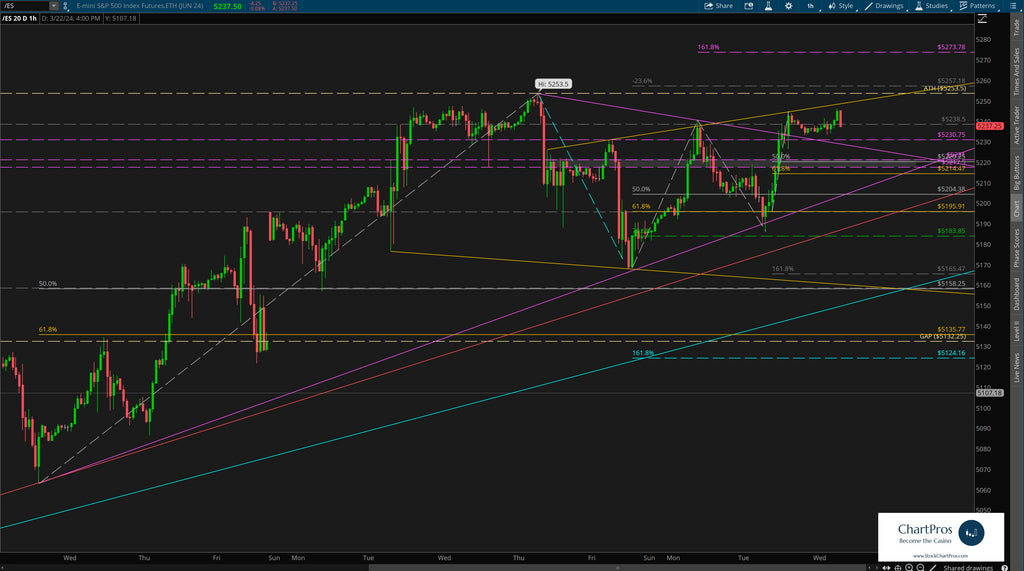
Tom's 1 Hour Personal Chart - For Illustration Purposes ONLY
Armed with precision oriented charts like these both traders and investors can formulate their respective plans.
Editors note: We'll update this post after today to see how price moved against the charts.
So what's next?
We don't make predictions...
Nobody knows for sure but using these 5 price action tools traders and investors can develop levels of interest in both directions.
- Support/Resistance
- Trend
- Fibonacci
- Supply/Demand Zones,
- Change Control Zones
ChartPros provides the exact methodology in its price action technical analysis courses to create charts like this with the most precise and accurate levels from which investors and traders can formulate their respective trade plans.
Take a look at the charts and let us know what you think.
We'd like to hear from you in the comments sections.
