March 25 Chart of the Day - Grand Canyon Education
Precision oriented price action technical analysis by far provides the best edges and most setups for traders across the markets so that's what we use for the basis of our reviews.
Grand Canyon Education, Inc. (LOPE) was incorporated in 2008 to usher in the next era of Grand Canyon University (GCU) - a small, struggling Christian school that has been in existence in Arizona since 1949. GCU started to grow its online operations in 2004 (formerly known as Significant Education LLC), but lacked a holistic vision for the next 20 years including its brand identity, effective and efficient operations, and system technology.
A management team led by President and Chief Executive Officer Brian Mueller and Chief Operating Officer Dr. Stan Meyer, who each brought 22 years of higher education experience, was installed and a new vision was imparted. To help make that vision a reality, GCE became a publicly traded company in November 2008 under the symbol LOPE on the NASDAQ National Market. Through an initial public offering, GCE obtained the necessary capital to invest in state-of-the-art education technologies, infrastructure and processes that will help grow enrollment at Grand Canyon University to 100,000 students by 2020.
And yes, it's the same Grand Canyon University that played in the NCAA March Madness tournament that so many of you asked about...
Seeing that they're pretty good on the court we wanted to take a look at their chart from a price action technical analysis perspective.
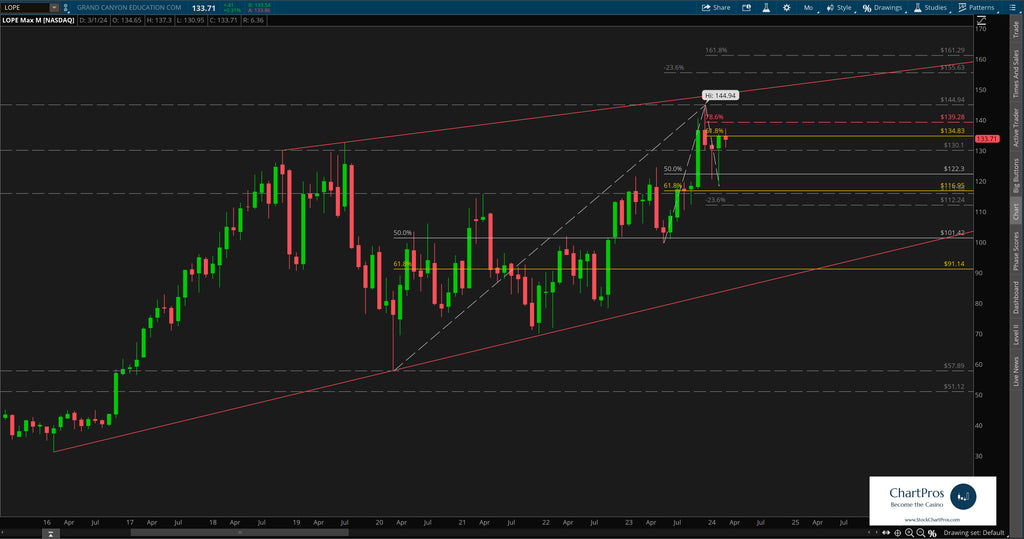
On the monthly chart we can see they've been around for a while and recently set their $144.94 all time high (ATH) last summer.
Price has faded since then, trading around $133 earlier today, but so far moving in a very technically correct manner.
Monthly Chart
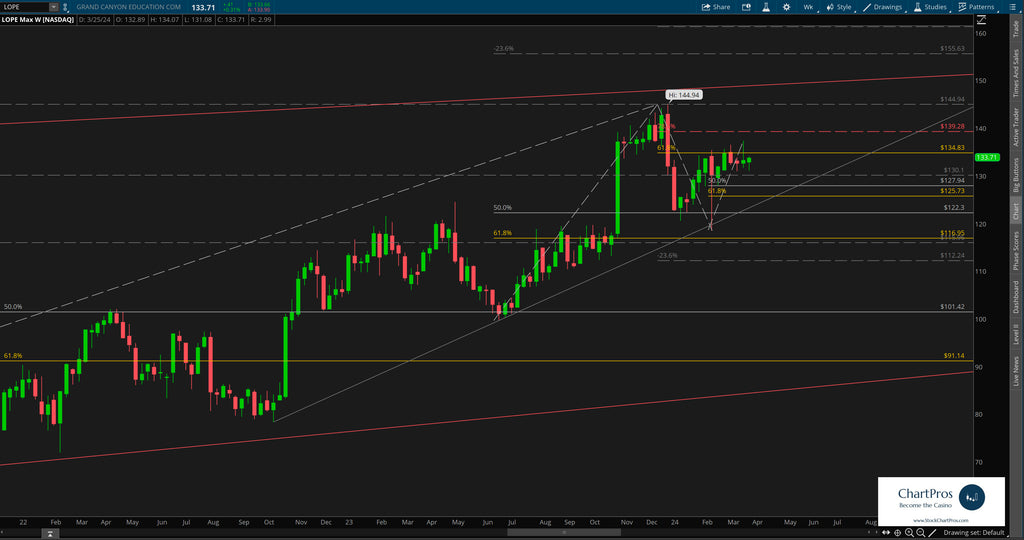
Down on the weekly chart we can see price teetering around previous ATH support/resistance seemingly deciding which way to go next.
We've layered in a bull Fibonacci sequence as well as another trend line to potentially identify pull back long opportunities.
Should the shorter term levels not hold it's a long ways down to our next level of interest in the $100 area.
Weekly Chart
Armed with precision oriented charts like these both traders and investors can formulate their respective plans.
So what's next?
We don't make predictions...
Nobody knows for sure but using these 5 price action tools traders and investors can develop levels of interest in both directions.
- Support/Resistance
- Trend
- Fibonacci
- Supply/Demand Zones,
- Change Control Zones
ChartPros provides the exact methodology in its price action technical analysis courses to create charts like this with the most precise and accurate levels from which investors and traders can formulate their respective trade plans.
Take a look at the charts and let us know what you think.
We'd like to hear from you in the comments sections.
