March 26 Chart of the Day - Hershey
Precision oriented price action technical analysis by far provides the best edges and most setups for traders across the markets so that's what we use for the basis of our reviews.
Attention all chocolate lovers… the cost of cocoa per metric ton has doubled in a very short time so stock up on your favorite chocolates while you can still get them…
Cocoa futures surged above an unprecedented $10,000 a metric ton, extending a historic rally which is raising the cost of chocolate.
Companies like Hershey (HSY) are in the headlines this week as they use cocoa as a primary ingredient in their products so we wanted to take a look at their chart from a price action technical analysis perspective.
Monthly Chart
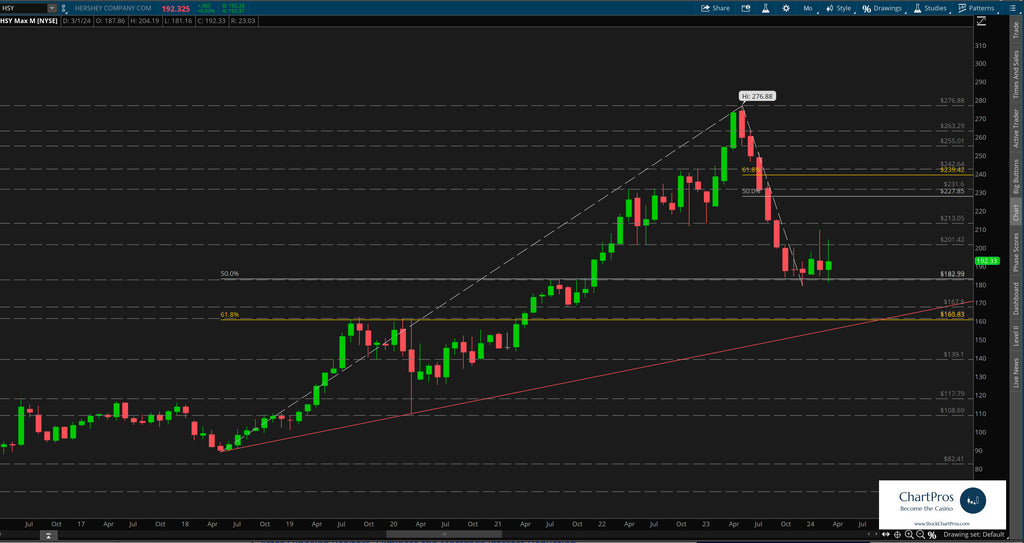
On the monthly chart we can see that price is well off its $276.88 all time high (ATH) set just about a year ago.
Price faded fast from that lofty level and to no surprise found its way back to previous ATH levels in the $183 area and has bouncing around there for a few months.
Price seemingly has a decision to make of whether to hold that major support/resistance level and factors beyond the company's control - like the extremely high cost of cocoa could just be the catalyst to push price down below there...
Weekly Chart

Down on the weekly chart we can see price dancing around essentially resulting in what could be considered a "relief bounce" so far.
But can the Hershey bulls step in to push price back up or will they possibly give in and let price keep fading.
If price decides to continue falling a potential target area could be the bull 61.8% retracement level that correlates to a major support/resistance level that has an ascending trend line just below there. If those levels were to fail price the bottom could really fall out as they say.
Armed with precision oriented charts like these both traders and investors can formulate their respective plans.
So what's next?
We don't make predictions...
Nobody knows for sure but using these 5 price action tools traders and investors can develop levels of interest in both directions.
- Support/Resistance
- Trend
- Fibonacci
- Supply/Demand Zones,
- Change Control Zones
ChartPros provides the exact methodology in its price action technical analysis courses to create charts like this with the most precise and accurate levels from which investors and traders can formulate their respective trade plans.
Take a look at the charts and let us know what you think.
We'd like to hear from you in the comments sections.
