March 28 Chart of the Day - Semtech Corporation
Precision oriented price action technical analysis by far provides the best edges and most setups for traders across the markets so that's what we use for the basis of our reviews.
Semtech Corporation (SMTC) is a high-performance semiconductor, IoT systems and Cloud connectivity service provider that reports earnings after market close today.
We wanted to review their chart from a price action technical analysis perspective because there's been a lot of upside price movement yesterday and today ahead of earnings...
Monthly Chart
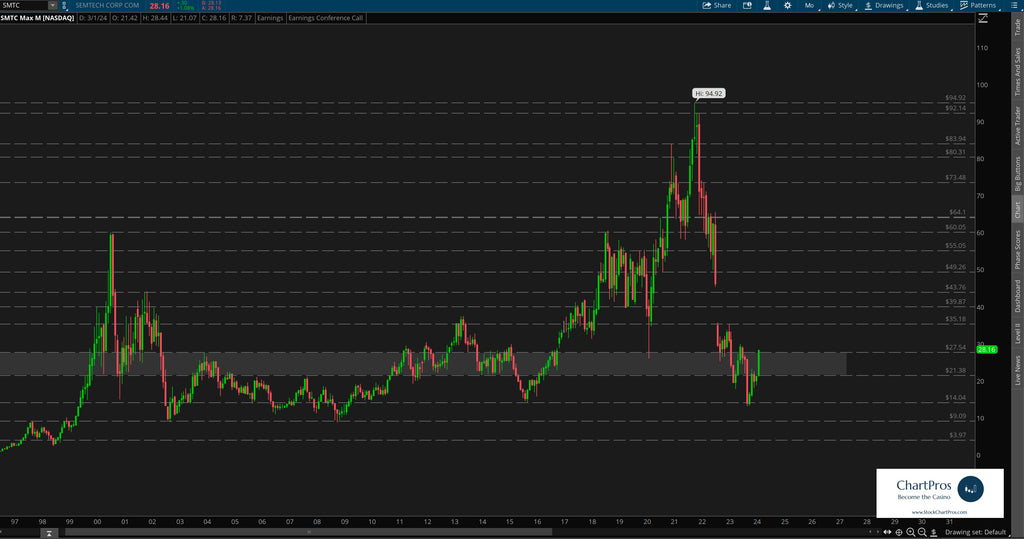
On the monthly chart we first noticed there's about three decades of historical price action which is something we prefer when reviewing equities.
We plotted only support and resistance on this view and noticed a change control zone (gray shaded rectangle) roughly between $21.25 and $27.50. With price trading at $28.16 earlier today we can see it's at the upper end of the zone.
Change control zones are one of the five price action tools we teach when charting anything. By definition, they are an area that represents where neither the bulls nor bears are in charge. Price can slash though the zone with seemingly reckless abandon, price can respect the top or bottom from outside it or within it. Or, price can trade aimlessly sideways within it. When price breaks away from the zone it can often get drawn back to it like a magnet. And in this case we see all of the above are true.
Weekly Chart
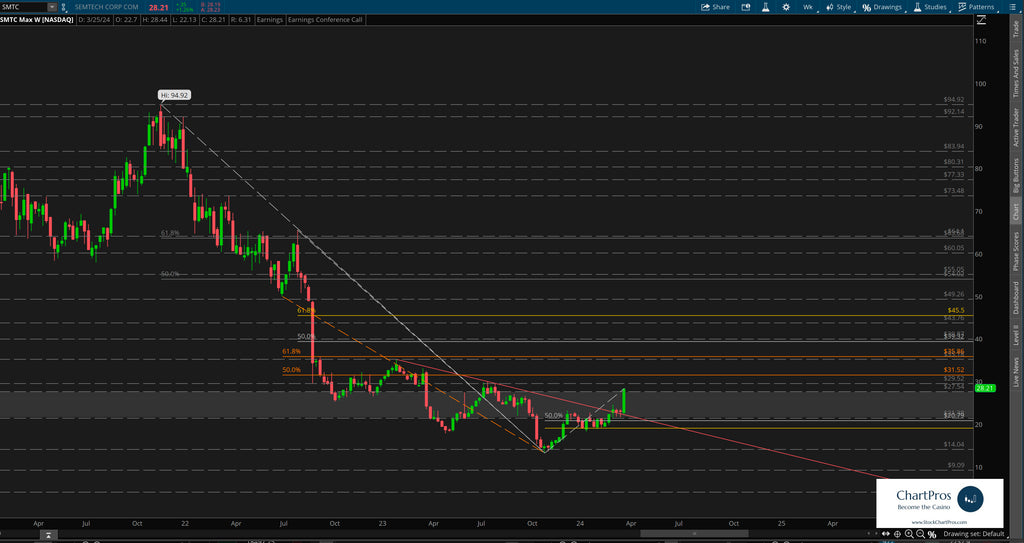
Down on the weekly chart we can see price seemingly broke out this week above a trendline and back up through the change control zone in an attempt to break its lower low, lower high cycle.
We've layered in Fibonacci in both directions to identify potential levels of interest.
One thing to note is an innovative application of an advanced "Low to Low" anchored bear Fibonacci concept (in orange) that we teach and you can learn about in our Free Fibonacci Guide.
It will be interesting to see if the earnings announcement later today attempts to push price back down through the change control zone or if it acts as an accelerant to price on the rise.
Armed with precision oriented charts like these both traders and investors can formulate their respective plans.
So what's next?
We don't make predictions...
Nobody knows for sure but using these 5 price action tools traders and investors can develop levels of interest in both directions.
- Support/Resistance
- Trend
- Fibonacci
- Supply/Demand Zones,
- Change Control Zones
ChartPros provides the exact methodology in its price action technical analysis courses to create charts like this with the most precise and accurate levels from which investors and traders can formulate their respective trade plans.
Take a look at the charts and let us know what you think.
We'd like to hear from you in the comments sections.
