March 5 Chart of the Day - Verisign
Precision oriented price action technical analysis by far provides the best edges and most setups for traders across the markets so that's what we use for the basis of our reviews.
Verisign (VRSN) is a tech firm that operates a diverse array of network infrastructure, including two of the Internet's thirteen root nameservers, the authoritative registry for the .com, .net, and .name generic top-level domains and the .cc country-code top-level domains, and the back-end systems for the .jobs and .edu sponsored top-level domains.
Wow, that's a mouthful...
Warren Buffet, the "Oracle of Omaha" reportedly holds a significant position in Verisign so they often gets scrutinized by the media for that reason alone.
The company is in the news this week because as the headlines indicate their stock price is down and lagging the tech sector so we wanted to review their chart from a price action technical analysis perspective.
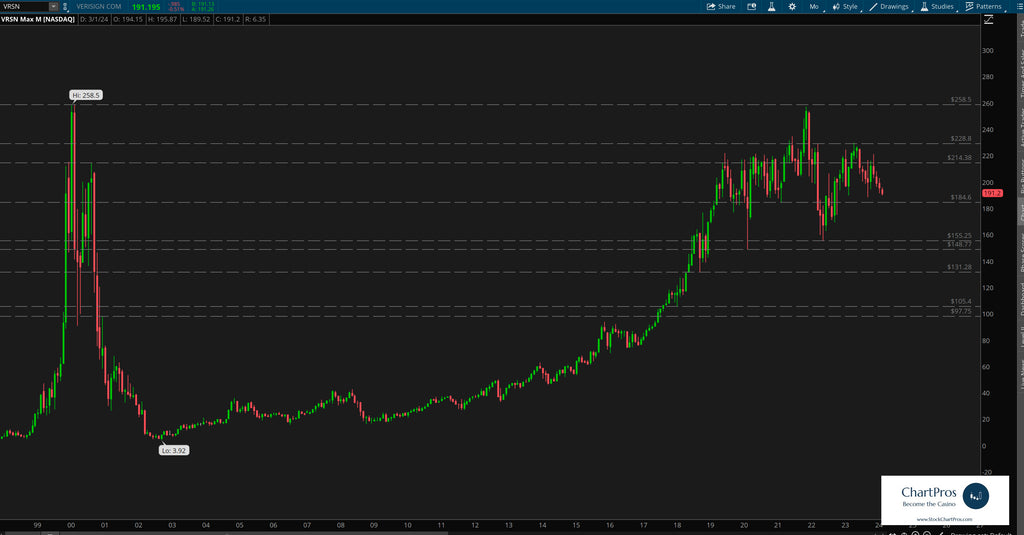
On the monthly view we only plotted support and resistance, a layout that we refer to as "basic structure." As one can see price often has a good memory moving from level to level. These levels can be used to trade and/or invest from.
Monthly
Looking at the weekly chart we've layered in a couple of trend lines, bull and bear Fibonacci retracements, and a change control zone roughly between $204 and $214 (gray shaded rectangle).
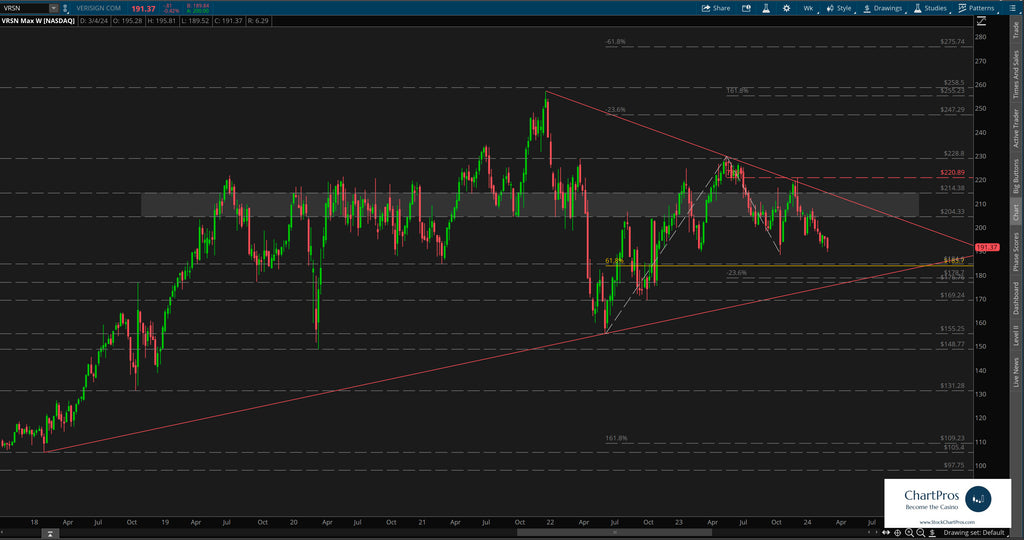
Armed with this precision oriented information both traders and investors can formulate their respective plans.
So what's next?
We don't make predictions...
Nobody knows for sure but using these 5 price action tools traders and investors can develop levels of interest in both directions.
- Support/Resistance
- Trend
- Fibonacci
- Supply/Demand Zones,
- Change Control Zones
ChartPros provides the exact methodology in its price action technical analysis courses to create charts like this with the most precise and accurate levels from which investors and traders can formulate their respective trade plans.
Take a look at the charts and let us know what you think.
We'd like to hear from you in the comments sections.