March 7 Chart of the Day - BJ's Wholesale Club
Precision oriented price action technical analysis by far provides the best edges and most setups for traders across the markets so that's what we use for the basis of our reviews.
Shares of BJ's Wholesale Club (BJ) are moving higher today as the company posted its fourth-quarter earnings, beating Wall Street expectations on the bottom line, but missing on the top line.
The irony in this is sometimes when a company does this their stock price goes down and sometimes it goes up so we wanted to review it from a price action technical analysis perspective.
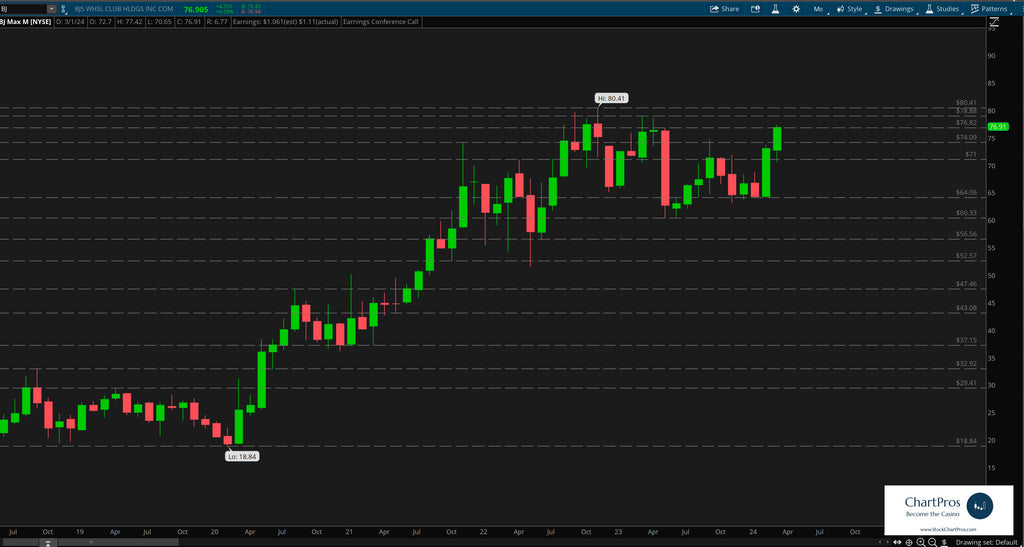
First, on the monthly chart we identified only support and resistance and built out a "ladder" so to speak of historical price movement. This is always step one for our analysis. From here we can choose to layer in additional price action tools or move down in time frame.
In this case we can see price has been making a series of higher highs and higher lows during the past 3 years (by definition this is an up trend).
The question traders and investors often have is will the trend continue or has a top been made.
Monthly Chart
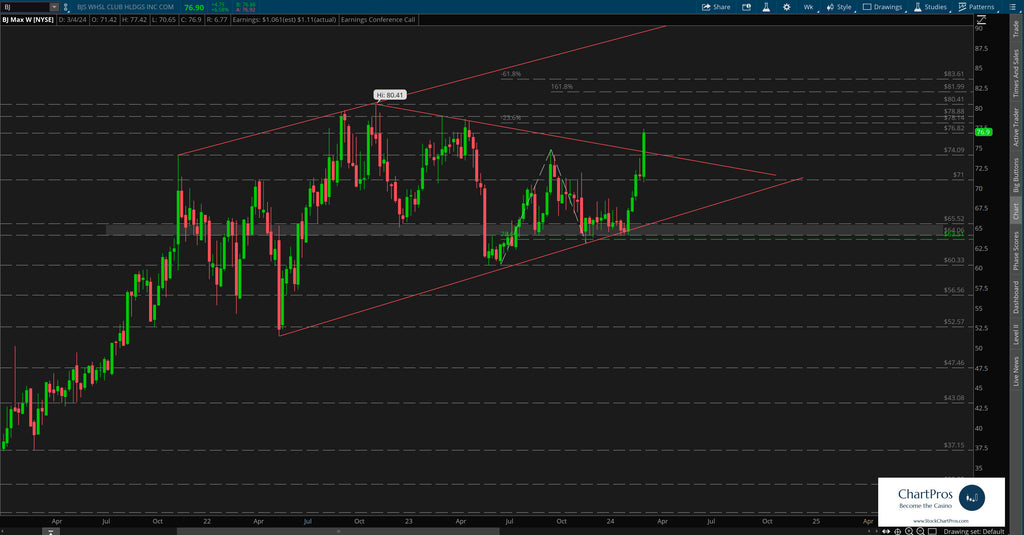
Next, we'll move down to the weekly view to see if any additional structure presents itself on the chart.
And in this case the answer is definitively yes!
We can see an upward channel and a downward sloping trend line slicing through the channel that seemingly broke out today.
We also identified a change control zone roughly between $64 and $65.50 (gray shaded rectangle).
Change control zones are one of the five price action tools we teach when charting anything. By definition, they are an area that represents where neither the bulls nor bears are in charge. Price can slash though the zone with seemingly reckless abandon, price can respect the top or bottom from outside it or within it. Or, price can trade aimlessly sideways within it. When price breaks away from the zone it can often get drawn back to it like a magnet. And in this case we see all of the above are true.
On this chart we can see that price crossed the zone a whopping 33 times during the past year and a half before recently and aggressively moving up and away from it.
Weekly Chart
Armed with this precision oriented information both traders and investors can formulate their respective plans.
So what's next?
We don't make predictions...
Nobody knows for sure but using these 5 price action tools traders and investors can develop levels of interest in both directions.
- Support/Resistance
- Trend
- Fibonacci
- Supply/Demand Zones,
- Change Control Zones
ChartPros provides the exact methodology in its price action technical analysis courses to create charts like this with the most precise and accurate levels from which investors and traders can formulate their respective trade plans.
Take a look at the charts and let us know what you think.
We'd like to hear from you in the comments sections.