March 8 Chart of the Day - Cloudflare
Precision oriented price action technical analysis by far provides the best edges and most setups for traders across the markets so that's what we use for the basis of our reviews.
San Francisco based Cloudflare, Inc. (NET) provides content delivery network services, cloud cybersecurity, DDoS mitigation, and ICANN-accredited domain registration services.
The company's stock rose quickly last month following its February 8 earnings report, exceeding analyst expectations and they also issued a rosy forecasts. The company accomplished impressive revenue growth last quarter and forecasted 27% growth next year.
Given all that we wanted to review their chart from a price action technical analysis perspective.
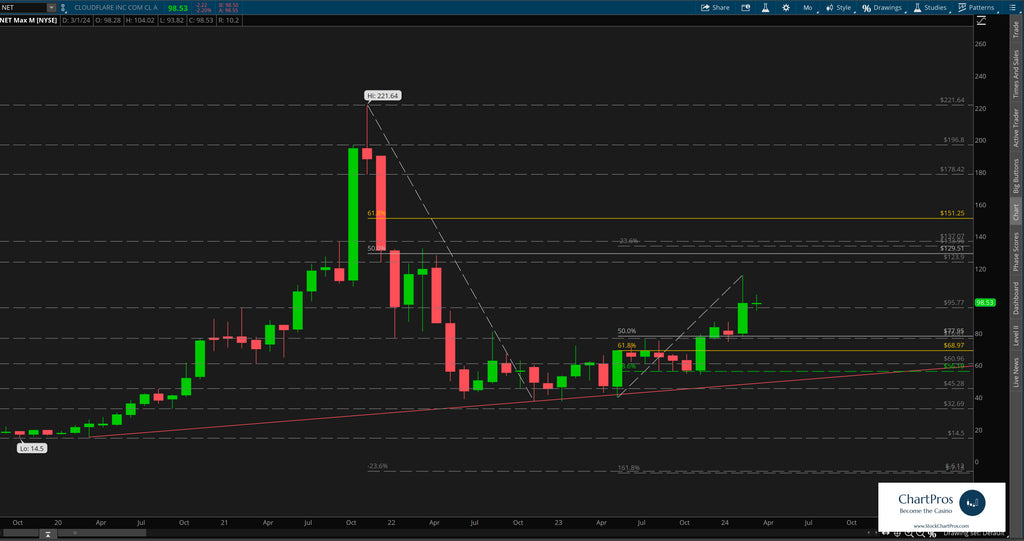
On the monthly chart we can see there's not decades of historical price action so newer stocks like this can tend to go through what we call a "discovery phase" for an extended period of time while building out chart "structure."
During the past few years we can see price has been making a series of higher highs and higher lows after setting a definitive bottom around $40.
After their earnings announcement last month price seemingly ran into some overhead resistance in the $115 area and has since faded to $99.10 where it was trading earlier today.
Monthly Chart
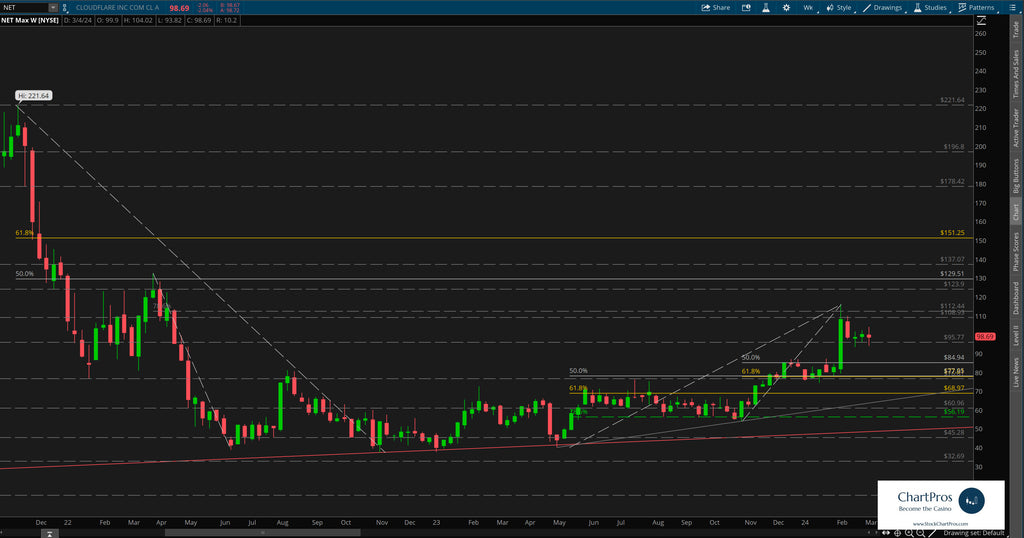
Next, we'll move down to the weekly view to see if any additional structure presents itself on the chart. And in this case the answer is definitively yes!
We can see where price faded last month at a support/resistance level as well as a Fibonacci 78.6% retracement. Price has been consolidating and moving sideways at a support level in the $95.77 area.
Price can often do this while deciding on what to do next.
We've layered in Fibonacci bull retracements in the event price decides it wants to continue falling.
Up above, the monthly bear Fibonacci retracement provides potential upside targets should price decide to move in that direction.
Weekly Chart
Armed with this precision oriented information both traders and investors can formulate their respective plans.
So what's next?
We don't make predictions...
Nobody knows for sure but using these 5 price action tools traders and investors can develop levels of interest in both directions.
- Support/Resistance
- Trend
- Fibonacci
- Supply/Demand Zones,
- Change Control Zones
ChartPros provides the exact methodology in its price action technical analysis courses to create charts like this with the most precise and accurate levels from which investors and traders can formulate their respective trade plans.
Take a look at the charts and let us know what you think.
We'd like to hear from you in the comments sections.