May 1 Chart of the Day - Zillow
Precision oriented price action technical analysis by far provides the best edges and most setups for traders across the markets so that's what we use for the basis of our reviews.
Zillow Group, Inc. (Z), or simply Zillow, is an American tech real-estate marketplace company that was founded in 2006.
They report earnings after market close today so we wanted to review their chart from a price action technical analysis perspective.
Monthly Chart
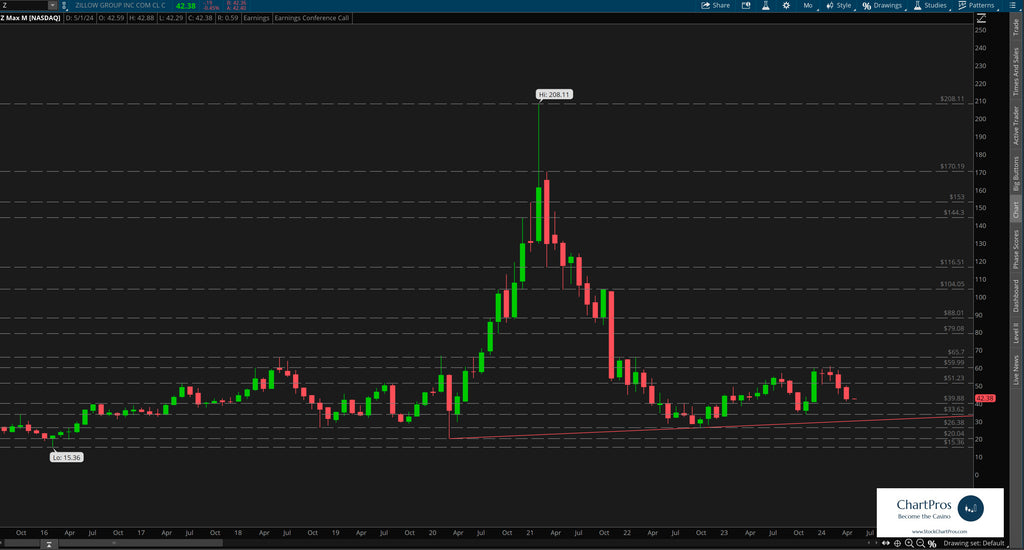
On the monthly chart we can see price is well off its $208.11 all time high (ATH) set back in 2021. Price plummeted all the way down to the $30 area before getting the proverbial "dead cat bounce..."
Trading around $42.35 earlier today we can see that price has been attempting to make a new series of higher highs and higher lows. Only time will tell if that will actually happen.
Weekly Chart with Price Targets for May 3
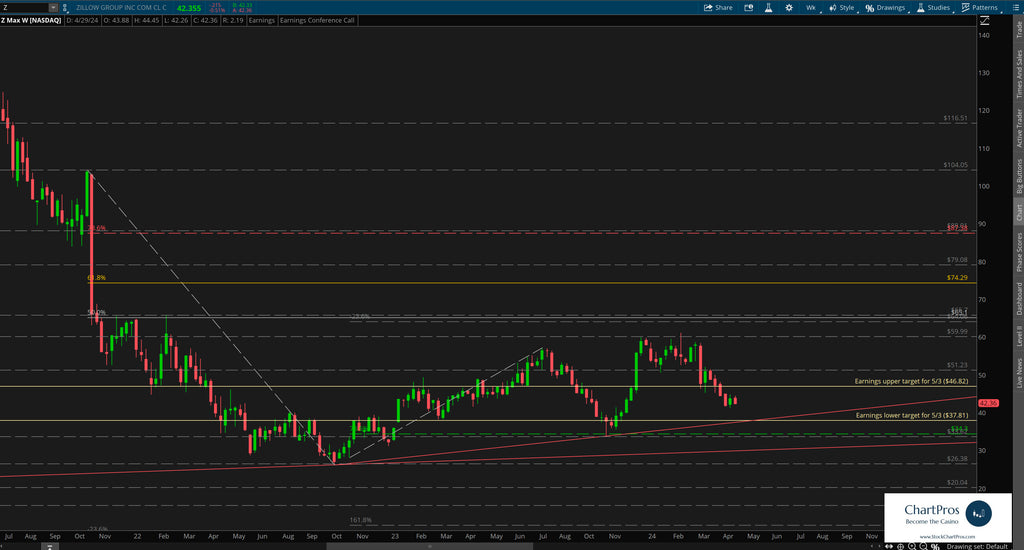
On the weekly chart we can see with much more clarity the attempt to make higher highs and higher lows.
If that were to happen, earnings could potentially be the catalyst to either make or break this current up trend.
In the meantime, we've also layered in Fibonacci levels in both directions to use as potential levels of interest and/or future price targets.
For earnings we've included the implied target moves the market is anticipating by Friday May 3 by using the at the money straddle option cost for that expiration.
Of interest to note, for each of the last 8 quarters price rose 50% of the time after earnings while falling the other 50% of the time.
Upside target - $46.82
Downside target - $37.81
Armed with precision oriented charts like these both traders and investors can formulate their respective plans.
So what's next?
We don't make predictions...
Nobody knows for sure but using these 5 price action tools traders and investors can develop levels of interest in both directions.
- Support/Resistance
- Trend
- Fibonacci
- Supply/Demand Zones,
- Change Control Zones
ChartPros provides the exact methodology in its price action technical analysis courses to create charts like this with the most precise and accurate levels from which investors and traders can formulate their respective trade plans.
Take a look at the charts and let us know what you think.
We'd like to hear from you in the comments sections.
