May 2 Chart of the Day - Apple
Precision oriented price action technical analysis by far provides the best edges and most setups for traders across the markets so that's what we use for the basis of our reviews.
Apple (AAPL) is among the most popular requests we get, especially on earnings day like today as the global tech giant reports after the closing bell.
Since the company reportedly has been experiencing slowing growth, particularly in China, we wanted to review their chart from a price action technical analysis perspective.
Weekly Chart
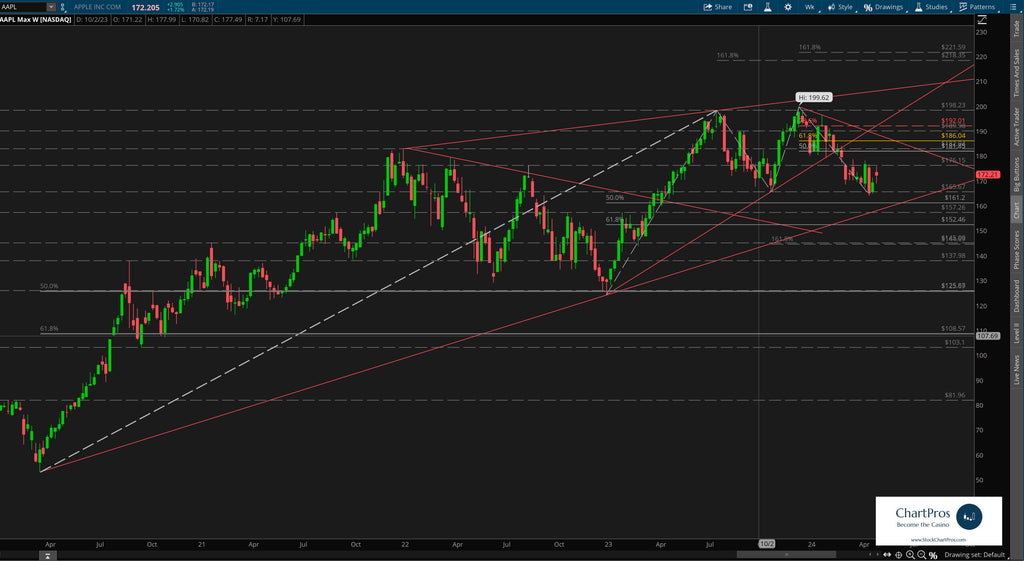
On the weekly chart we can see price is well off its $199.62 all time high (ATH) set back in late 2023. Since then, price has been making a series of lower highs and lower lows essentially trading in the same area it did back in 2021...
Trading around $172.25 earlier today we can see that price has been trading somewhat range bound this calendar year roughly between $165 - $175.
Daily Chart with Price Targets for May 3
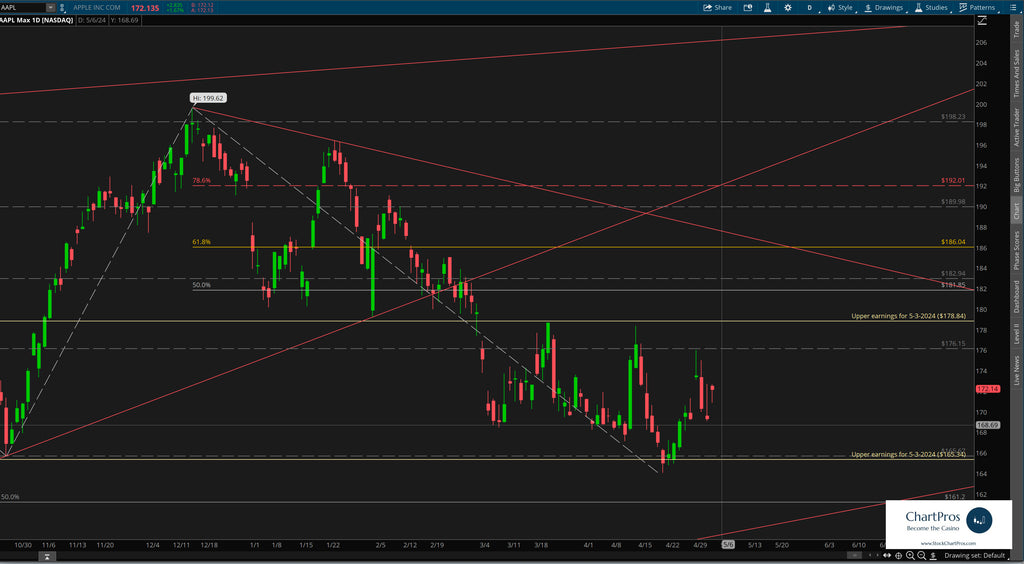
On the daily chart we can see with much more clarity the recent range after fading from ATHs.
Ironically, the market is anticipating about a $6.75 move in either direction by market close on May 3 which essentially would put price at the upper or lower boundary of the recent range...
We've also layered in Fibonacci levels in both directions to use as potential levels of interest and/or future price targets.
Notably, for each of the last 8 quarters price rose 7 times after earnings while falling only once.
Upside target - $178.84
Downside target - $165.34
Armed with precision oriented charts like these both traders and investors can formulate their respective plans.
So what's next?
We don't make predictions...
Nobody knows for sure but using these 5 price action tools traders and investors can develop levels of interest in both directions.
- Support/Resistance
- Trend
- Fibonacci
- Supply/Demand Zones,
- Change Control Zones
ChartPros provides the exact methodology in its price action technical analysis courses to create charts like this with the most precise and accurate levels from which investors and traders can formulate their respective trade plans.
Take a look at the charts and let us know what you think.
We'd like to hear from you in the comments sections.
