May 8 Chart of the Day - Shopify
Precision oriented price action technical analysis by far provides the best edges and most setups for traders across the markets so that's what we use for the basis of our reviews.
Shopify (SHOP) is a leading e-commerce platform for online stores and retail point-of-sale systems that reported disappointing projected growth during its earnings call.
Its share price was trading down about 20% earlier today so we wanted to review their chart from a price action technical analysis perspective.
Monthly Chart
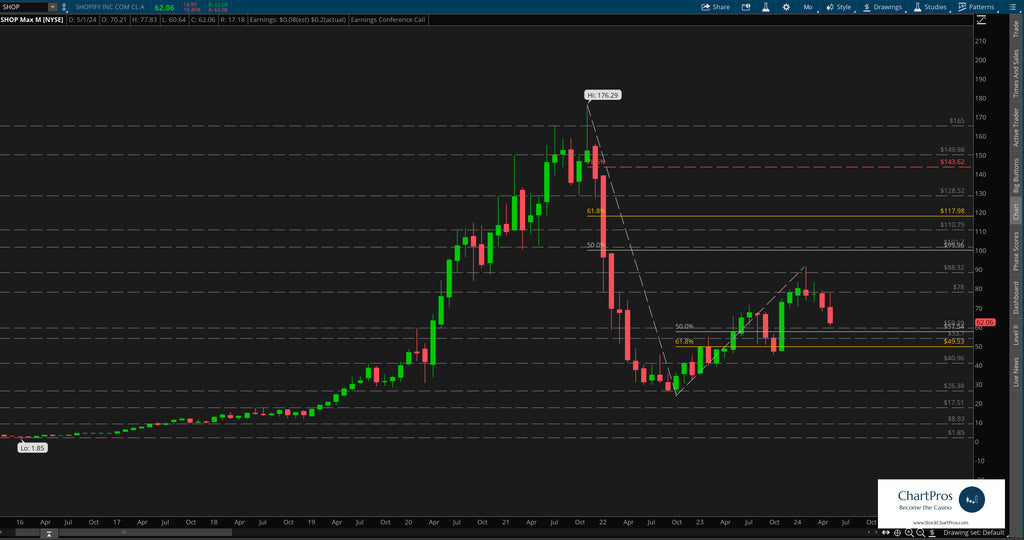
On the monthly chart we can see that after setting its $176.29 all time high (ATH) back in the 2022 price fell dramatically and seemingly found a bottom and bounced around the $25 area.
With a recent series of higher highs and higher lows price bounced back up to the $90 area before today's abrupt drop.
Weekly Chart
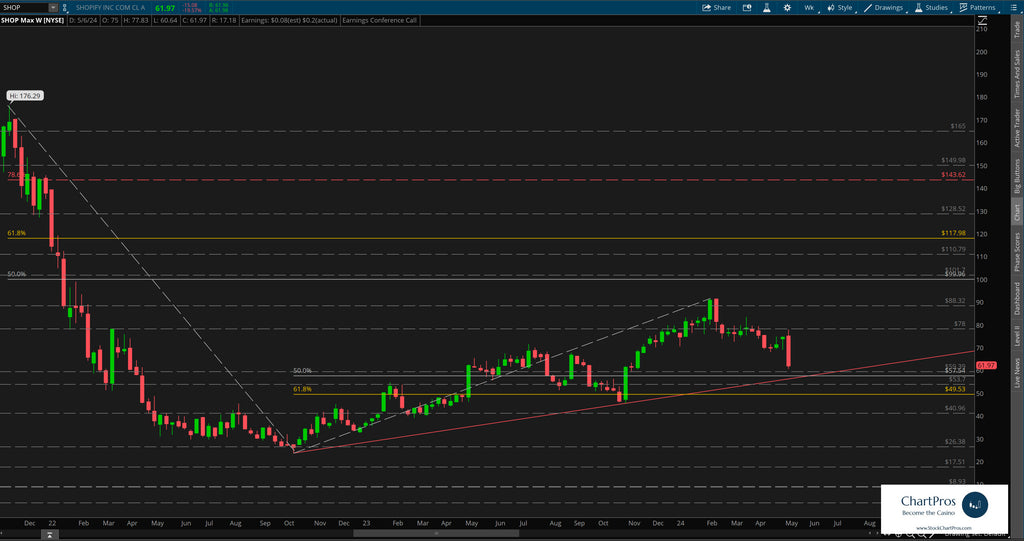
On the weekly chart we can see with much more clarity the recent up trend.
Trading around $62 earlier today price may have an upcoming decision to make in the form of a bull Fibonacci retracement zone, support/resistance, and trend.
While it's not the last chance for the bulls to step in, it's potentially an area of confluence that could create another lower high.
We've layered in Fibonacci levels in both directions to use as potential levels of interest and/or future price targets.
Armed with precision oriented charts like these both traders and investors can formulate their respective plans.
So what's next?
We don't make predictions...
Nobody knows for sure but using these 5 price action tools traders and investors can develop levels of interest in both directions.
- Support/Resistance
- Trend
- Fibonacci
- Supply/Demand Zones,
- Change Control Zones
ChartPros provides the exact methodology in its price action technical analysis courses to create charts like this with the most precise and accurate levels from which investors and traders can formulate their respective trade plans.
Take a look at the charts and let us know what you think.
We'd like to hear from you in the comments sections.
