October 6 Chart of the Day - Exxon Mobil
If you've been following our Chart of the Day posts and have benefited from one or more of them we ask that you consider participating our NEW Pay It Forward - Traders Helping Traders program.
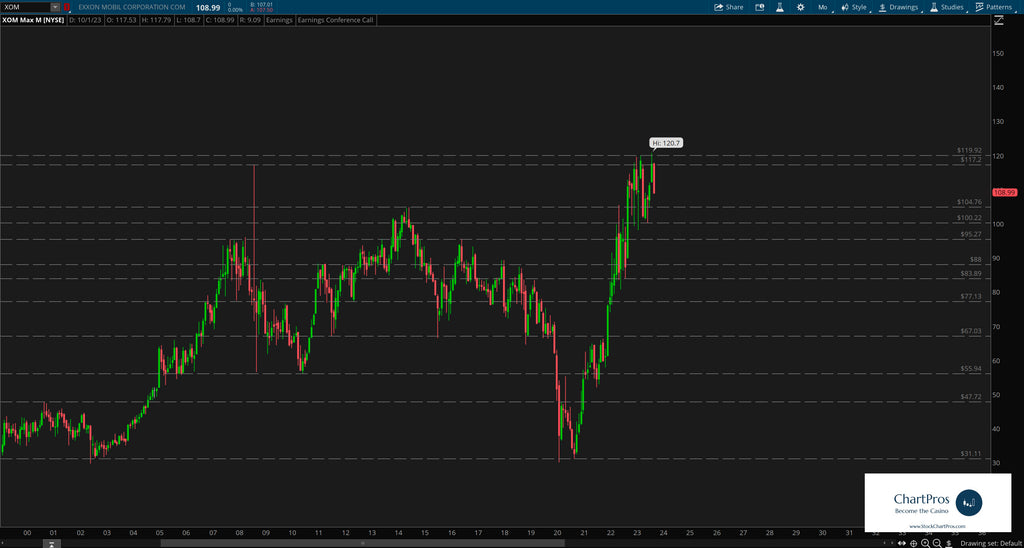
Exxon Mobil (XOM) is the world's largest nongovernment-owned energy company. Today we'll take a look at the company's chart using only Support / Resistance and Trend as taught in our MOST POPULAR price action technical analysis course.
On the monthly chart we can see price retreating from its $120.70 all time high (ATH) back down towards previous structure.
One could develop a trade plan simply from this chart without costly indicators, signals, studies...
Going further down on the weekly chart we can add a few trend lines to further see where the downward price movement could go in the $100-$105 area.
Often, price can pick a level to ping pong between /aka/ a range before ultimately picking a more permanent direction and breaking out of that range.
For the past year we can see a range between $100 and $120 with a lot of "noise" in between.
Ranges can often be traded until they break...
So what's next?
We don't make predictions...
Nobody knows for sure but using these 5 price action tools traders and investors can develop levels of interest in both directions.
- Support/Resistance
- Trend
- Fibonacci
- Supply/Demand Zones,
- Change Control Zones
Take a look at the charts and let us know what you think.
We'd like to hear from you in the comments sections.
Have a chart you'd like to see featured?
Send requests at https://stockchartpros.com/community/contact
Would you like charts like this delivered directly to you every day? ChartPros Trade Room is offering an OPEN HOUSE 7-day free trial at this link.