September 14 Chart of the Day - MGM
If you've been following our Chart of the Day posts and have benefited from one or more of them we ask that you consider participating our NEW Pay It Forward - Traders Helping Traders program.
Shares of MGM Resorts International (MGM) fell after the hotel and casino operator informed the Securities and Exchange Commission (SEC) about a cybersecurity attack, suggesting it will have a material effect on the company.

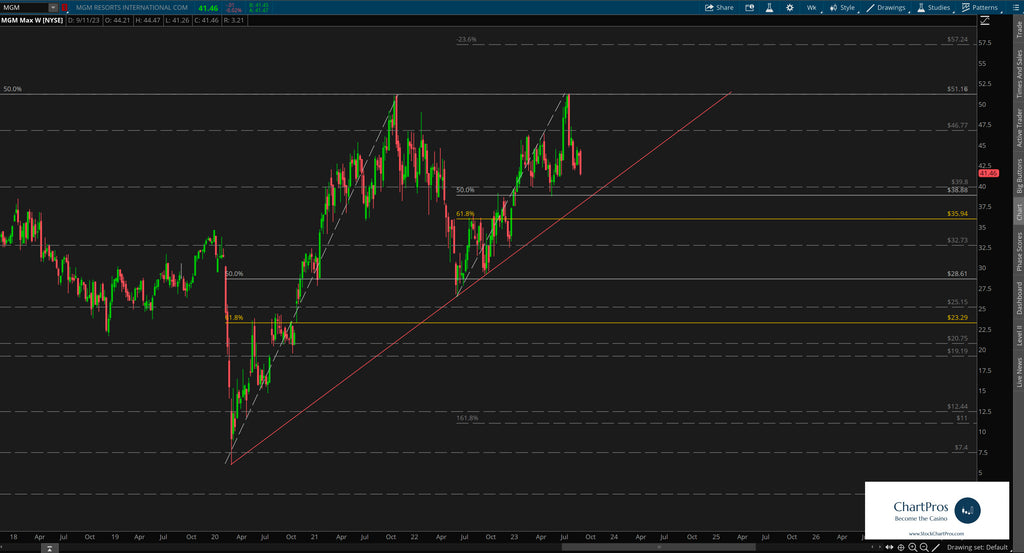
Price is trading down this week currently in the $41 area after double tapping a major line in the land resistance level up at $51 a little over a month ago.
But since bottoming out back in March 2020 below $7.50 price has been making a series of higher highs and higher lows.
Investors and traders have had much to be excited about since then. But can price break and hold above $50 to return to its "glory days?"
See the monthly and weekly charts below as we've identified levels of interest in both directions in trying to determine and answer the question of "where could price go..."
So what's next?
We don't make predictions...
Nobody knows for sure but using these 5 price action tools traders and investors can develop levels of interest in both directions.
- Support/Resistance
- Trend
- Fibonacci
- Supply/Demand Zones,
- Change Control Zones
Take a look at the charts and let us know what you think.
We'd like to hear from you in the comments sections.
Have a chart you'd like to see featured?
Send requests at https://stockchartpros.com/community/contact
Would you like charts like this delivered directly to you every day? ChartPros Trade Room is offering an OPEN HOUSE 7-day free trial at this link.