Technical Analysis or News?

(This is an updated post to include recent news and recent charts because this scenario occurs over and over again...)
Remember the recent doom and gloom headlines?
There's been a long running debate between the technical analysis chartists and the fundamentalists and both sides can make their case for being "right". Both sides often think that their way is best and the other side is full of you know what...
We speak from first hand experience. You see, we once were fundamentalists but now pretty much technical analysis junkies. Why you may ask? Because it just seems to work literally all the time.
Take the recent market surge for example You can see in the charts below an anticipated level of interest for a potential turn in price action which has played out.
Since no one can predict the future how did the recent economic news data this past week "cause" the markets to move like they did?
Coincidence?
We think not. Because so often news events become catalysts for price action movement that just so happens to fit nicely within technical analysis.
So what exactly is this technical analysis stuff all about?
All we use are these 5 Price Action tools that are native to every charting platform out there.
- Support/Resistance
- Trend
- Fibonacci
- Supply/Demand Zones,
- Change Control Zones
And that's it, nothing else.
Occasionally we'll use a momentum study but never any proprietary indicators, studies, signals, etc.
So if you're like we are and seeing is believing just continue to follow us, or better yet, join us and we're confident that you'll become a believer in the power of technical analysis.
We are not in the prediction business nor do we play that game of calling market tops or bottoms. We simply are passionate about technical analysis and react off of our precision focused levels.
The more you learn about technical analysis, the better it can help you as a trader to become more confident and consistent. Good luck to us all!
(This is an updated post to include recent news and recent charts because this scenario occurs over and over again...)
S&P 500 January 2025

S&P 500 July 2024

Intel August 2024


Tesla April 2024
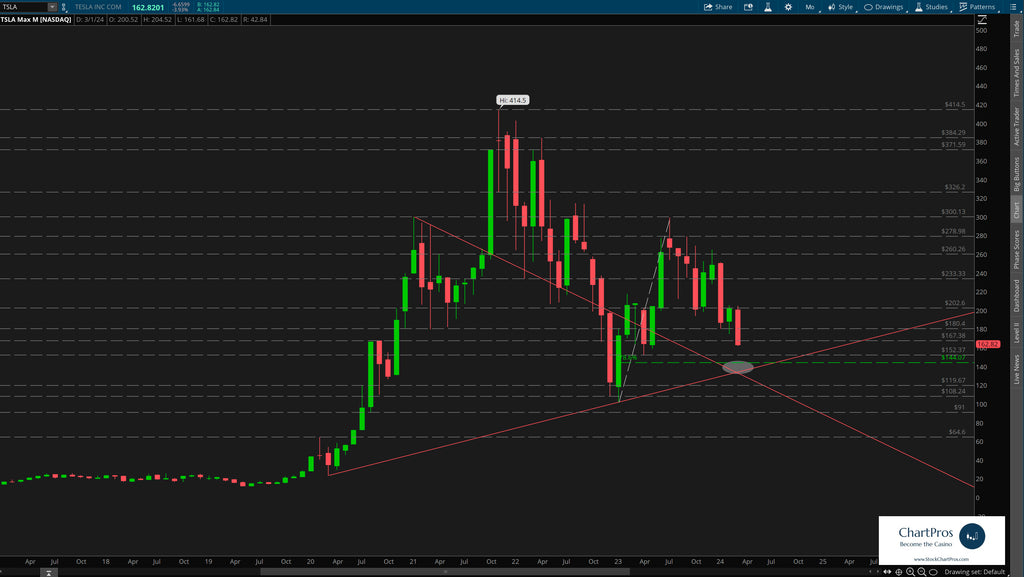

Where Could Price Go?
Remember, we always want to be able to answer where could price go... Not where will price go. If price melts through your support levels use a higher time frame chart so you can see that the market is still technically intact.
Because You Were Interested in this FREE Top Market Insights Story...
You may also be interested in these other FREE resources!
- Million Dollar Mindset: Top 5 Techniques for Sticking to Your Trading Plan
- How to Know When to Enter a Trade
- The Ultimate Stop Loss Guide: Enhance Your Trading Strategy and Boost Your Confidence
- Anatomy of a Winning Intraday Price Action Trade Plan
- See How This Done-With-You Market Mastery Trading Bootcamp Can Help You With These Techniques and Change Your Trading Forever!
- ChartPros Named Best Trading System to Learn for Supplemental Income

Thank you, I love this stuff.