April 5 Chart of the Day - Oil
Precision oriented price action technical analysis by far provides the best edges and most setups for traders across the markets so that's what we use for the basis of our reviews.
Oil (/CL) prices hit their highest level since October as tensions in the Middle East escalated. And as we all know this means higher gas prices at the pump.
With this in mind we wanted to review Oil's chart from a price action technical analysis perspective to see where price could potentially be heading.
Monthly Chart
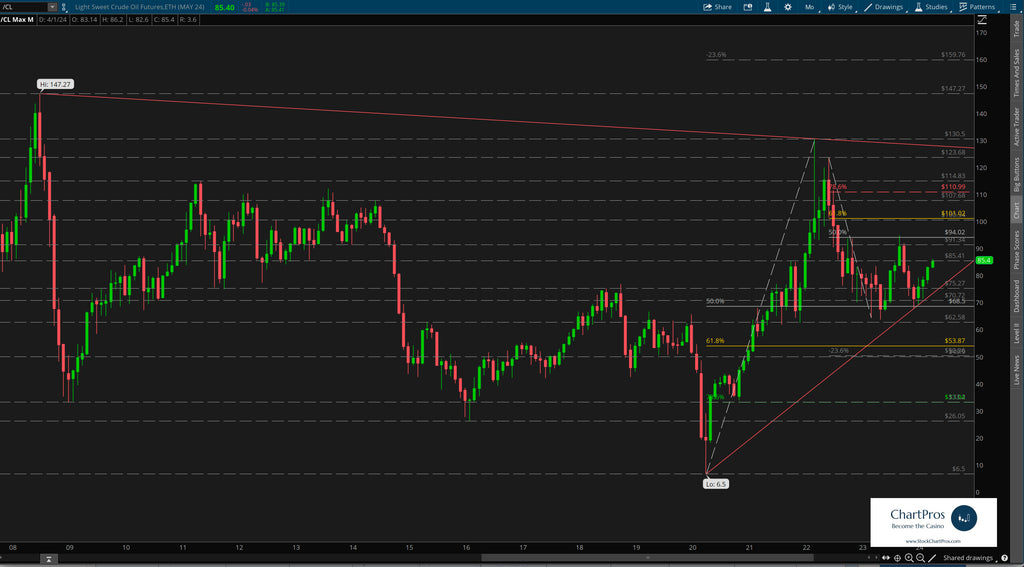
On the monthly chart we noticed that price essentially has been trading within a pretty wide range roughly between $70 and $95 making 3 round trips in the past 18 months or so.
Trading around $87 earlier today price is seemingly on its next trip to the top of the range. The big question is what will price do if it gets up there again?
Overhead targets above that range include $100, $110, or possibly even higher than that.
Weekly Chart
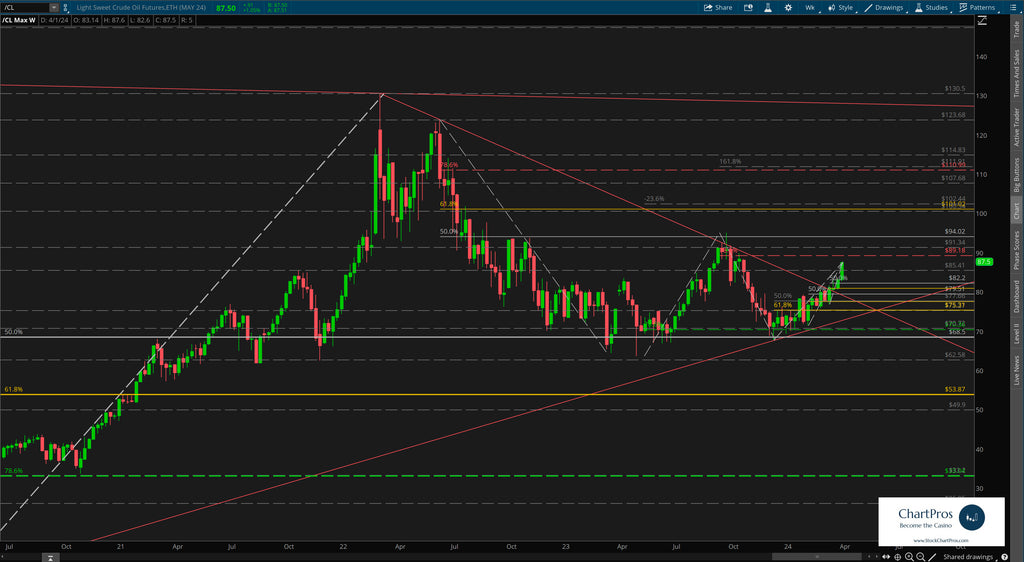
On the weekly chart we can see the orderly price movement within the range with much more clarity.
We've layered in Fibonacci in both directions as well as a wedge that price recently broke out of to help identify potential levels of interest should it want to fall and revisit that area of the chart.
Armed with precision oriented charts like these both traders and investors can formulate their respective plans.
So what's next?
We don't make predictions...
Nobody knows for sure but using these 5 price action tools traders and investors can develop levels of interest in both directions.
- Support/Resistance
- Trend
- Fibonacci
- Supply/Demand Zones,
- Change Control Zones
ChartPros provides the exact methodology in its price action technical analysis courses to create charts like this with the most precise and accurate levels from which investors and traders can formulate their respective trade plans.
Take a look at the charts and let us know what you think.
We'd like to hear from you in the comments sections.
