February 22 Chart of the Day - NICE
Precision oriented price action technical analysis by far provides the best edges and most setups for traders across the markets so that's what we use for the basis of our reviews.
Nice (ticker NICE) is making headlines today for posting better than anticipated earnings.
According to the company's website "NICE empowers organizations to deliver extraordinary and hyper-personalized customer experiences across digital and voice channels and from any location with our AI-infused cloud native CX platform."
Ohhhh, there's that AI term that many tech companies have included within their product sets.
We were not familiar with the company so we wanted to review their charts from a price action technical analysis perspective.
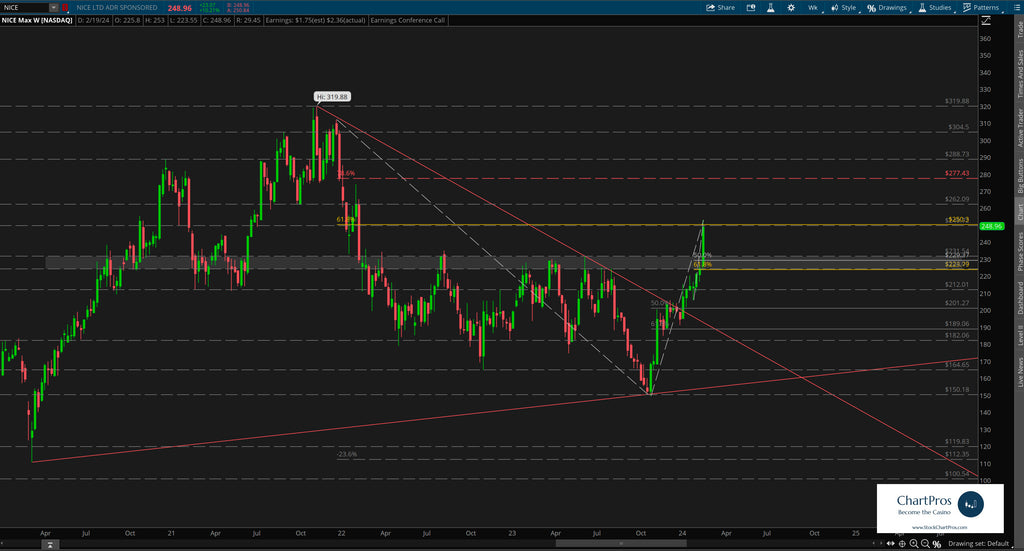
On the monthly chart we can see that there is nearly three decades of historical information with its $319.88 all time high (ATH) set in late 2021. But since then and for whatever reasons price fell in dramatic fashion down to the $150 area in late 2023 before popping back up about $100 like an AI related company to its current $250 trade price.

Down on the weekly chart we can see that just in the last week price powered up and through a change control zone roughly between $224 and $230.
Change control zones are one of the five price action tools we teach when charting anything. By definition, they are an area that represents where neither the bulls nor bears are in charge. Price can slash though the zone with seemingly reckless abandon, price can respect the top or bottom from outside it or within it. Or, price can trade aimlessly sideways within it. When price breaks away from the zone it can often get drawn back to it like a magnet. And in this case we see all of the above are true.
Today, price finds itself bumping up potential resistance in the form of a bear 61.8% Fibonacci retracement and previous support/resistance level so it will be interesting to see how price behaves around this area.
If price were to fade from here back towards the change control zone we've layered in bull Fibonacci retracement levels that seemingly align with that zone...
Armed with this precision oriented information both traders and investors can formulate their respective plans.
So what's next?
We don't make predictions...
Nobody knows for sure but using these 5 price action tools traders and investors can develop levels of interest in both directions.
- Support/Resistance
- Trend
- Fibonacci
- Supply/Demand Zones,
- Change Control Zones
ChartPros provides the exact methodology in its price action technical analysis courses to create charts like this with the most precise and accurate levels from which investors and traders can formulate their respective trade plans.
Take a look at the charts and let us know what you think.
We'd like to hear from you in the comments sections.
Have a chart you'd like to see featured?
Send requests at https://stockchartpros.com/community/contact
Would you like charts like this delivered directly to you every day? ChartPros Trade Room is offering an OPEN HOUSE 7-day free trial at this link.
Experience a Week In the Life of a ChartPros Trade Room Member!