February 23 Chart of the Day - Etsy
Precision oriented price action technical analysis by far provides the best edges and most setups for traders across the markets so that's what we use for the basis of our reviews.
Etsy's (ETSY) eCommerce marketplace connects roughly 9 million independent sellers of mostly handcrafted items with more than 90 million buyers. The company earns revenue from listing and transaction fees, as well as by selling advertising to sellers, among other sources.
The company reported mixed results yesterday and was trading down so we wanted to review their chart from a price action technical analysis perspective.
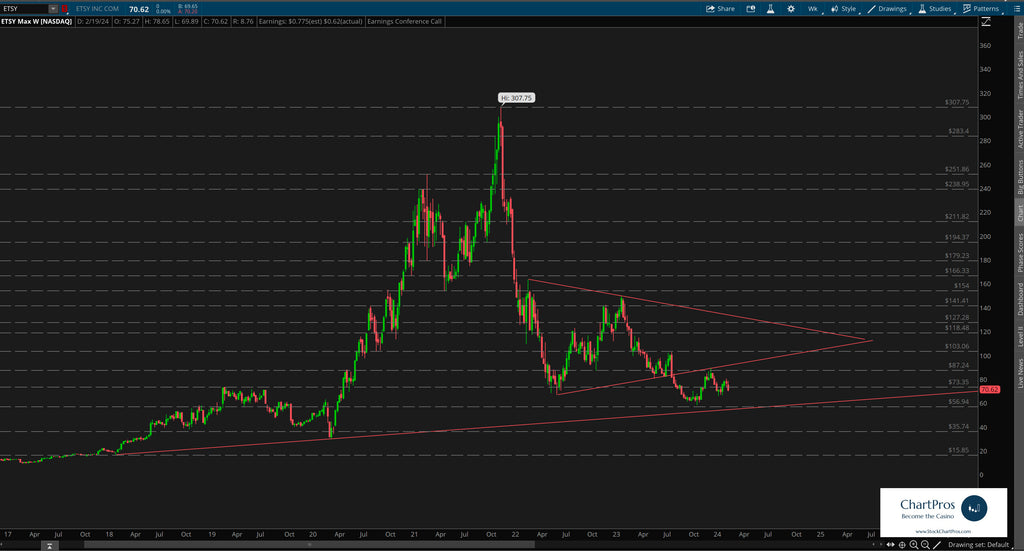
First, on the zoomed out weekly chart we created a "basic structure" view point using only support/resistance and trend.
We can see over time how price reacted at or near the levels often times moving level to level respecting and seemingly moving in an orderly fashion. Along the way price formed a wedge that it ultimately broke out of and came back up for a nice retest.
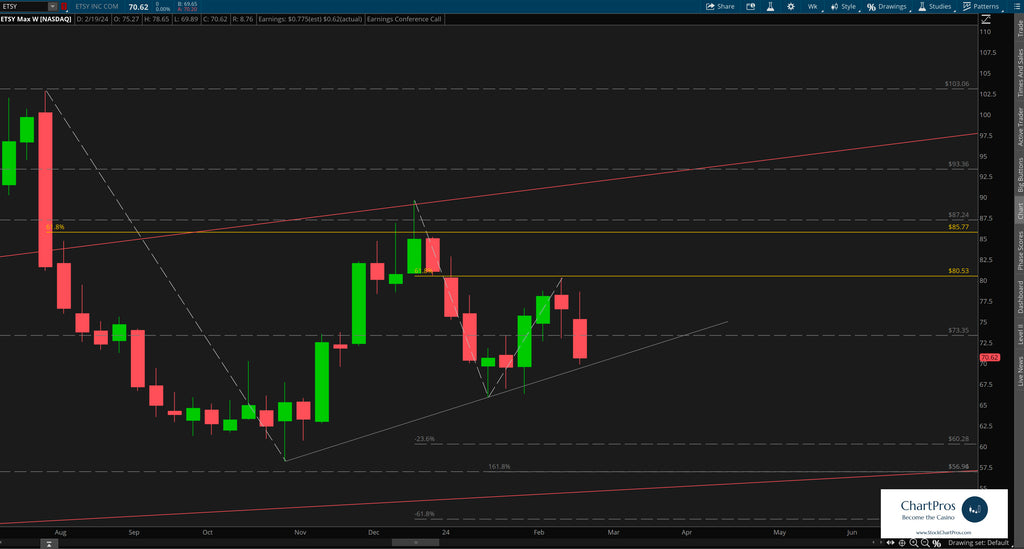
Next, we zoomed in on the weekly view and added additional price action tools in the form of Fibonacci (a trending tool) and another shorter more recent trend line (light gray).
From here we can see how price continued to move down in an orderly fashion respecting the Fib levels.
But where could price be heading?
Perhaps down to the lower red trend line that we identified on the zoomed out view.
Armed with this precision oriented information both traders and investors can formulate their respective plans.
So what's next?
We don't make predictions...
Nobody knows for sure but using these 5 price action tools traders and investors can develop levels of interest in both directions.
- Support/Resistance
- Trend
- Fibonacci
- Supply/Demand Zones,
- Change Control Zones
ChartPros provides the exact methodology in its price action technical analysis courses to create charts like this with the most precise and accurate levels from which investors and traders can formulate their respective trade plans.
Take a look at the charts and let us know what you think.
We'd like to hear from you in the comments sections.
Have a chart you'd like to see featured?
Send requests at https://stockchartpros.com/community/contact
Would you like charts like this delivered directly to you every day? ChartPros Trade Room is offering an OPEN HOUSE 7-day free trial at this link.
Experience a Week In the Life of a ChartPros Trade Room Member!