February 28 Chart of the Day - First Solar
Precision oriented price action technical analysis by far provides the best edges and most setups for traders across the markets so that's what we use for the basis of our reviews.
First Solar (FSLR) is making headlines today after reporting 4th quarter earnings with positive full year guidance per published reports.
Shares are trading about 2% higher today near $148 and the fundamentalists would lead you to believe that's because of the rosy outlook...
But us "chartists" that use price action technical analysis wanted to review the chart to see how price has been behaving over the long term.
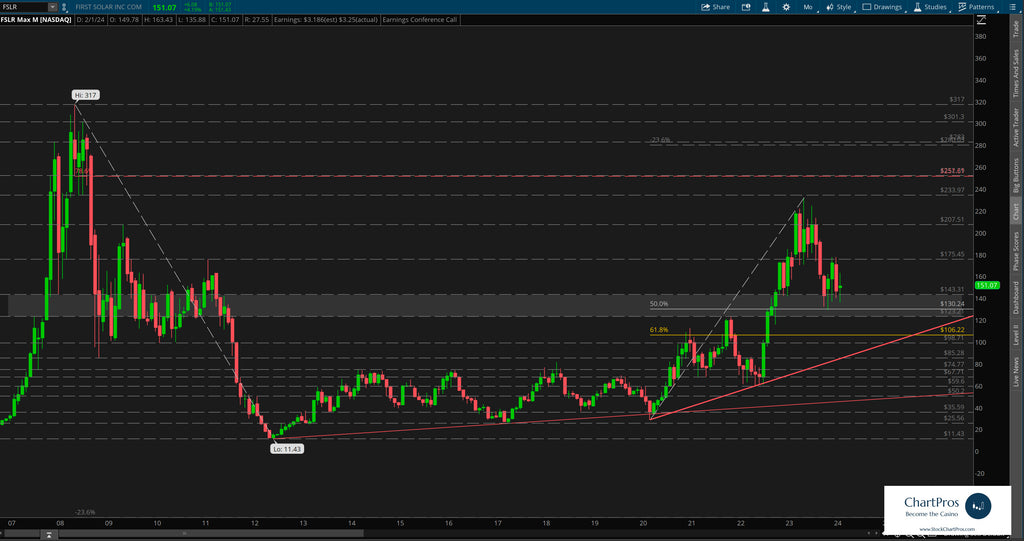
With that in mind we set out to first look at the monthly chart. From here we can see nearly two decades of historical information which is helpful because more data can provide for more precise analysis.
One of the first things we noticed was the extremes between the $317 all time high (ATH) set back in 2008 and the fall from grace soon thereafter all the way down to $11.43.
After setting that low price rebounded some but pretty much traded within a range between $40 and $80 for about seven years.
However, approximately two years ago price broke out of that range and ascended all the way up to $220 area before fading back down to its current level.
During all that time price carved out a change control zone roughly between $123 and $143 (gray shaded rectangle)
Change control zones are one of the five price action tools we teach when charting anything. By definition, they are an area that represents where neither the bulls nor bears are in charge. Price can slash though the zone with seemingly reckless abandon, price can respect the top or bottom from outside it or within it. Or, price can trade aimlessly sideways within it. When price breaks away from the zone it can often get drawn back to it like a magnet. And in this case we see all of the above are true.
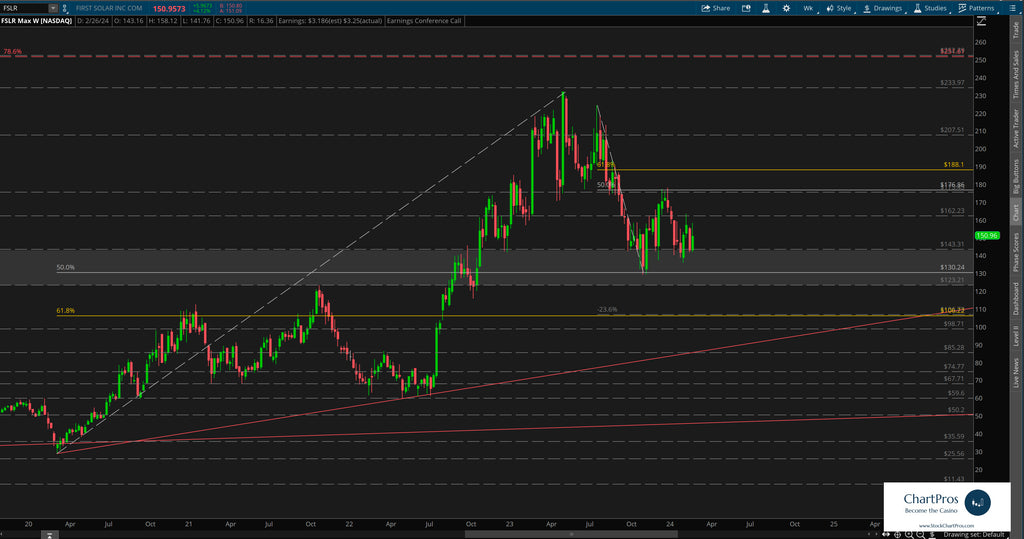
Down on the weekly chart we can see a series of higher highs and higher lows during the past few years (an uptrend). Along the way price we can see price flirting with the change control zone 11 times with the most recent respect of the top edge this week.
Price could decide to continue criss crossing the zone, respecting its edges, get inside of it and trade sideways, or aggressively break away from it again in either direction.
Armed with this precision oriented information both traders and investors can formulate their respective plans.
So what's next?
We don't make predictions...
Nobody knows for sure but using these 5 price action tools traders and investors can develop levels of interest in both directions.
- Support/Resistance
- Trend
- Fibonacci
- Supply/Demand Zones,
- Change Control Zones
ChartPros provides the exact methodology in its price action technical analysis courses to create charts like this with the most precise and accurate levels from which investors and traders can formulate their respective trade plans.
Take a look at the charts and let us know what you think.
We'd like to hear from you in the comments sections.
Have a chart you'd like to see featured?
Send requests at https://stockchartpros.com/community/contact
Would you like charts like this delivered directly to you every day? ChartPros Trade Room is offering an OPEN HOUSE 7-day free trial at this link.
Experience a Week In the Life of a ChartPros Trade Room Member!