June 16 Chart of the Day - EUR/USD
With 8 out the the last 12 days producing a green candle can the EUR/USD bulls keep pushing higher?
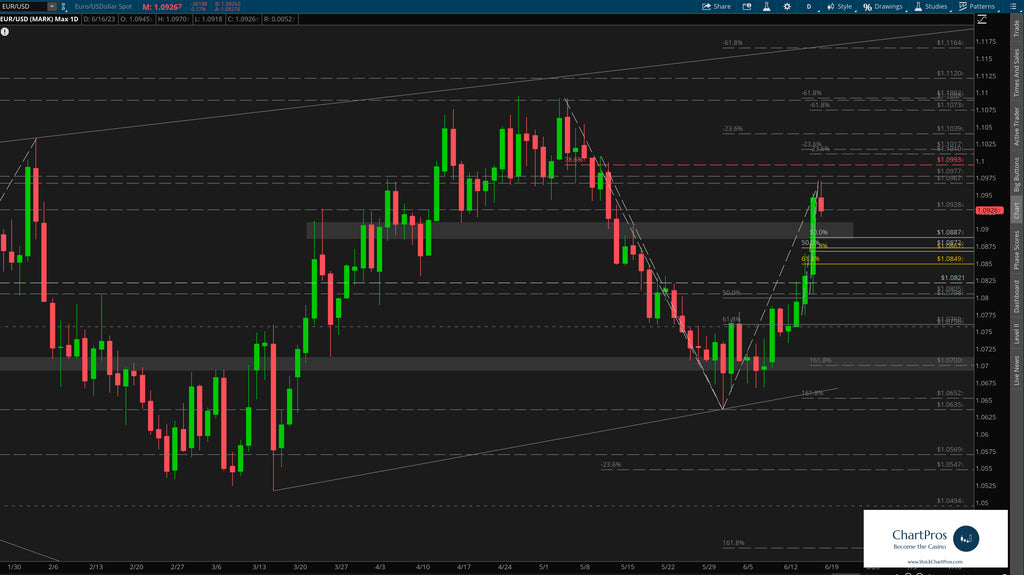
After creating a decisive bottom near 1.064 price has been charging hard towards a psychological "big round number" 1.10 including powering up and through a daily change control zone as if it didn't even exist...
But now price seems like it may want to go back and revisit that area before deciding what it wants to do. Because let's face it, price can do whatever it wants at anytime for any reason...
Levels of interest for a potential pull back long could be at the bottom of the change control zone around the 1.0887 level. But if price decides it wants to continue marching upwards it may be targeting 1.1 before determining its next leg.
So what's next?
Nobody knows for sure but using these 5 price action tools traders and investors can develop levels of interest in both directions.
- Support/Resistance
- Trend
- Fibonacci
- Supply/Demand Zones,
- Change Control Zones
Take a look at the charts and let us know what you think.
We'd like to hear from you in the comments sections.
Have a chart you'd like to see featured?
Send requests at https://stockchartpros.com/community/contact
Would you like charts like this delivered directly to you every day? ChartPros Trade Room is offering a 7-day free trial at this link.