Struggling With Inconsistent Trading Results? START HERE >

ChartPros Market Insights

May 16 Chart of the Day - BABA

May 16 Chart of the Day - BABA

Alibaba Group Holding Limited (NYSE: BABA and HKEX: 9988, "Alibaba" or "Alibaba Group") will report its unaudited financial results for the quarter and fiscal year ended March 31, 2023 before the U.S. market opens on Thursday, May 18, 2023, and will hold a conference call to discuss the financial results at 7:30 a.m. U.S. Eastern Time (7:30 p.m. Hong Kong Time) the same day.

For the last 8 quarters price has advanced 50% of the time and declined 50% of the time during earnings week. 

Would you like charts like this delivered directly to you every day?  ChartPros Trade Room is offering a 7-day free trial at this link.

Chart of the Day May 15 - Home Depot

Chart of the Day May 15 - Home Depot

Home Depot (HD) is set to report earnings before market open on Tuesday May 16, 2023.  Based on recent options activity the market is anticipating about a $14.65 move in either direction by the close of market on Friday May 19th.

Would you like charts like this delivered directly to you every day?  ChartPros Trade Room is offering a 7-day free trial at this link.

May 12 Chart of the Day - Disney

May 12 Chart of the Day - Disney

Should Disney (DIS) long term investors be worried about the stock price's recent and continued battering or should they see it as a time to add more to their portfolio?  Short term traders have had excellent conditions to trade its volatility in both directions between $90 and $115.

The question becomes when will that range break and in which direction?

May 11 Chart of the Day - Dow Jones Industrial Average

May 11 Chart of the Day - Dow Jones Industrial Average

The Dow futures ticker /YM hourly pre-market chart for today is suggesting an upcoming directional decision may be coming soon based on its volatile but range bound moves the past few days.

See what could happen today!


May 10 Chart of the Day - PayPal

May 10 Chart of the Day - PayPal

PayPal (PYPL) bears have been in the driver's seat since its lofty $310 all time high back in July 2021.

Since then price has fallen through each possible support level without any sustainable push by PayPal bulls.

Winning the Trading Game: Understanding the Importance of Trading Psychology

Winning the Trading Game: Understanding the Importance of Trading Psychology
Trading psychology is one of the most often-overlooked aspects of trading, but it is one of the most critical factors that can make or break a trader's success. The psychology of traders plays a significant role in determining their approach to the markets and their ability to perform under pressure. As a trader, understanding trading psychology can help you make more informed decisions and improve your confidence and chances of consistent success in the trading game.

May 9 Chart of the Day - Microsoft

May 9 Chart of the Day - Microsoft
Microsoft (MSFT) bulls have dominated the chart in 2023 so far. Recently powering through two weekly resistance levels price could possibly face another major resistance zone in the $316.50 - $323.35 area especially if $305 and $295 levels hold on any pull backs.

May 8 Chart of the Day - CROX

May 8 Chart of the Day - CROX
After exploding to the the upside since June 2022 from $45 to $150+ CROX has recently taken a breather and fallen back to the $110 area.  Some investors interpret this as a normal and healthy pull back but some traders seem to think the sky is falling with no bottom in sight. 

May 4 Chart of the Day - Apple

May 4 Chart of the Day - Apple
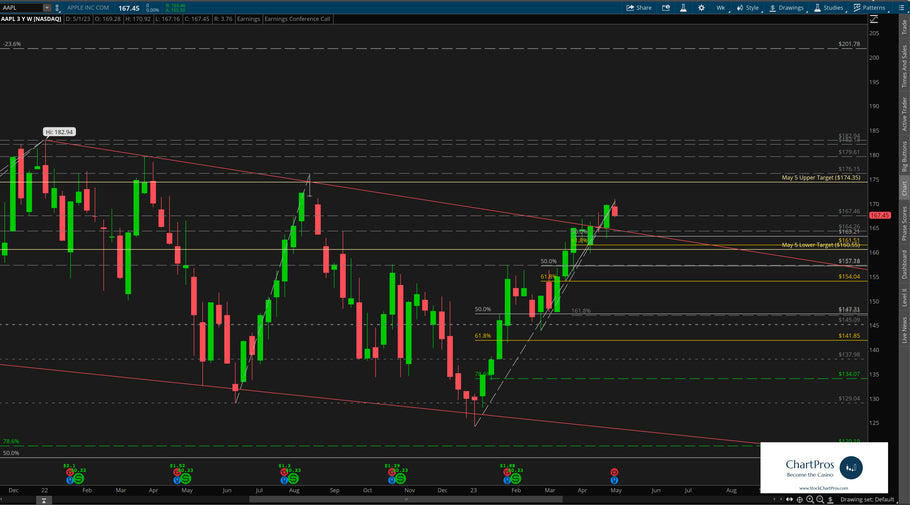
Apple (AAPL) is set to report earnings after market close on Thursday May 4, 2023.  The market is anticipating about a $6.90 move in either direction by the close of market on Friday May 5th.

May 3 Chart of the Day - Bank of America

May 3 Chart of the Day - Bank of America
With renewed pressures on the banking industry Bank of America (BAC) could see some more selling pressure down in the $20 area but if regulators or white knights continue to provide life lines to failing banks then BAC price could gain some upward momentum north of $30-$35. 

May 2 Chart of the Day NASDAQ

May 2 Chart of the Day NASDAQ
After a healthy retracement look for the #NASDAQ to find some support for a bounce back to the upside.  With FOMC on May 3, Apple earnings on May 4, and NFP report May 5 traders can anticipate further volatility this week.

May 1 Chart of the Day - Gold

May 1 Chart of the Day - Gold
Gold /GC has been extremely bullish since Halloween and recently consolidating and thinking about it's next move... If price can hold 2006 on the daily chart this week look for potential upside targets of 2020-2030+